|
<< Click to Display Table of Contents >> Distribution Qualitative Profile |
  
|
|
<< Click to Display Table of Contents >> Distribution Qualitative Profile |
  
|
Overview
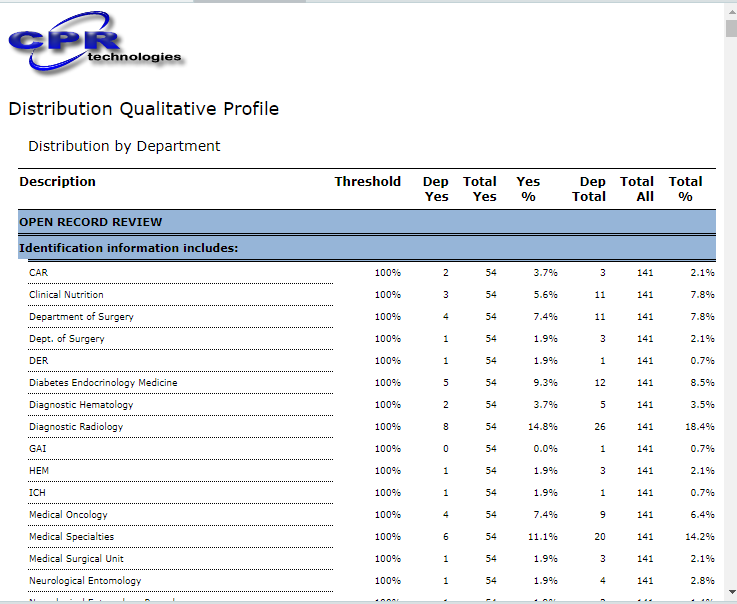
The Distribution Qualitative Profile report has been designed to compare attributes for a given criterion. An example would be to compare distribution of evaluated criterion by department.
To understand which criterion get reported see the Filter section in Topics And Criterion.
Clicking on the Parent Criterion 'Description' collapses the criterion and sub-criterion under it. Comments can be added to the criterion by right clicking on the 'Description'. To add a comment to the report, right click on '[END OF REPORT]'.

How to interpret the report:
The above sample report has been run for compliance 'Yes' and had been distributed by 'Departments'. The intent is to compare the departments amongst each other. If we look at the first row for 'Cardiology' it is showing there were 2 'Yes' out of a total 54 criterion reviewed. The report is telling us that 'Cardiology' contributed to 3.7% of compliance out of those worksheets reviewed for the criterion Identification information includes.
Report Columns
Description: Topic's And Criterion's long description.
Threshold: Threshold as defined in Topic Editor
*Yes / No: Total Compliance (Yes) or Total Non-compliance (No) depending upon what was chosen for 'Report On' in the Selecting Report Parameters dialog box.
*Total: Total number of criterion evaluated.
*%: Percentage of Compliance (Yes) or percentage of Non-compliance (No) depending upon what was chosen for 'Report On' in the Selecting Report Parameters dialog box. 'N/A' is shown when Total is zero.
* These columns appear twice, once for the distribution and another for the total.