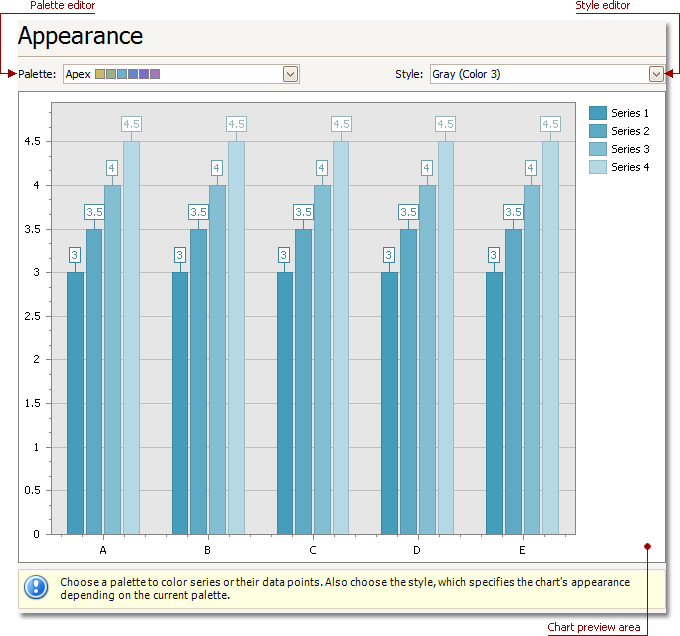
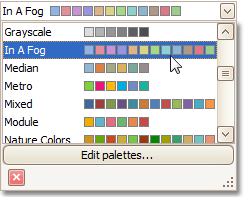
•Choose a palette to color a series.
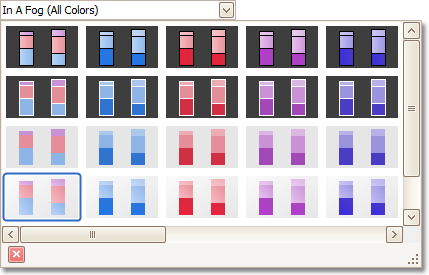
•Choose the style specifying the chart's appearance.

Chart preview area
Previews a chart's layout.
Palette Editor
Specifies a palette to color a series.

Style Editor
Specifies the style determining the chart's appearance, depending on the selected palette.

•Improve this Doc