•Customize axes properties;
•Customize the appearance of axis labels;
•Add a constant line and a strip to an axis;
•Enable automatic and manual scale breaks.

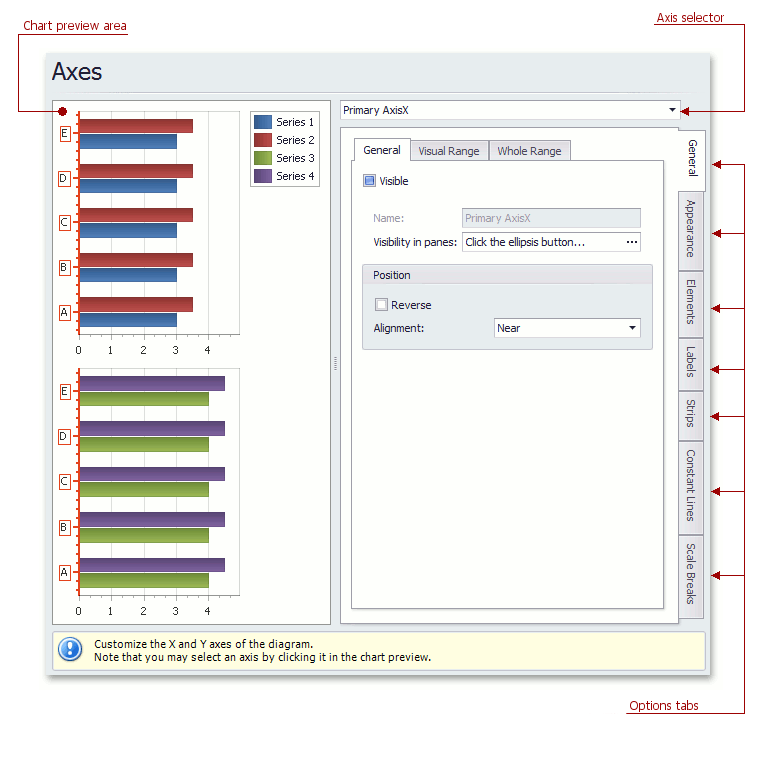
Chart preview area
Previews a chart's layout.
Note that you can select an axis to be modified on the chart preview area directly.
Axis selector
Specifies an axis to be customized.
Options tabs
The following tabs are available on this page.
•General
Specifies visibility, position, range and format properties.
•Appearance
Defines color, thickness and interlacing options.
•Elements
Customizes title, tickmarks and grid line properties.
•Labels
Specifies position and text for automatically created labels, or allows custom labels to be defined.
•Strips
Allows you to create strips, define their visibility, name, limits, appearance, etc.
•Constant Lines
Allows you to create constant lines, specify whether the constant line should be checkable or checked in a legend, define their visibility, name, value, legend text, appearance, title, etc.
•Scale Breaks
Allows you to enable automatic and / or create custom scale breaks, and define their appearance.