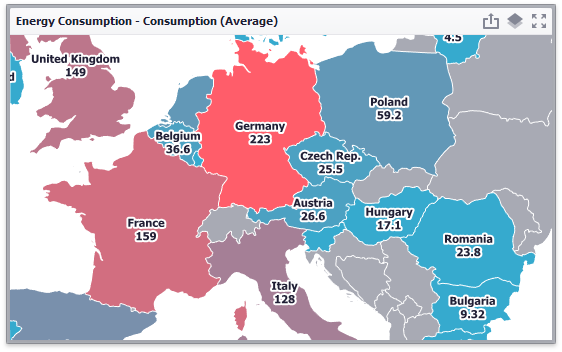
The topics in this section describe the features available in the Choropleth Map dashboard item.
The Choropleth Map dashboard item allows you to colorize the required areas in proportion to the provided values.

This section consists of the following subsections:
Describes how to use default dashboard maps or provide custom maps.
Explains how to supply the Choropleth Map dashboard item with data.
Details how to color map shapes based on the values provided.
Explains how to manage map zooming and scrolling.
Describes features that enable interaction between the Choropleth Map and other dashboard items.
Describes how to display additional information related to map shapes.
Explains the map legend and its options.