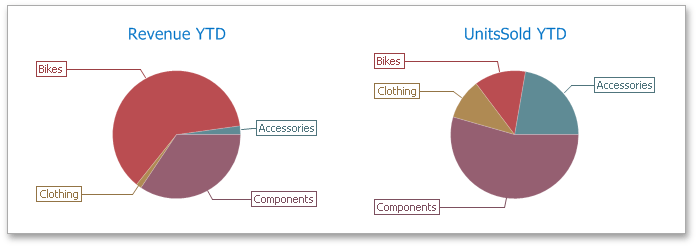
The Pie dashboard item displays a series of pies or donuts that represent the contribution of each value to a total.

This section consists of the following subsections:
Describes how to supply the Pie dashboard item with data.
Describes features that enable interaction between the Pie dashboard item and other items.
Describes coloring capabilities of the Pie dashboard item.
Describes layout options of the Pie dashboard item.
Explains how to customize data labels and tooltips.
Describes how to select the style of pie charts.