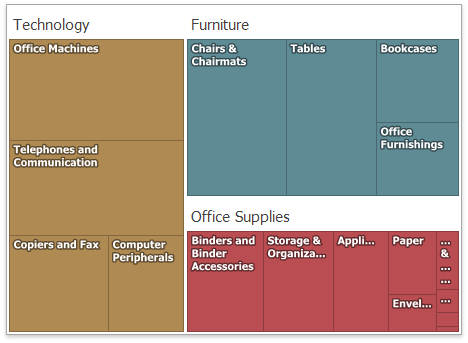
Use the Treemap dashboard item to visualize data in nested rectangles that are called tiles.

This section is divided into the following subsections.
<< Click to Display Table of Contents >>
Use the Treemap dashboard item to visualize data in nested rectangles that are called tiles.

This section is divided into the following subsections.