Refer to the following topics for instructions on how to add charts and pivot grids to reports:
Use the Chart control to add a chart to a report.
•Add a Chart (Set Up Series Manually)
•Add a Chart (Use a Series Template)
•Use Charts to Visualize Grouped Data
•Link a Chart and a Pivot Grid
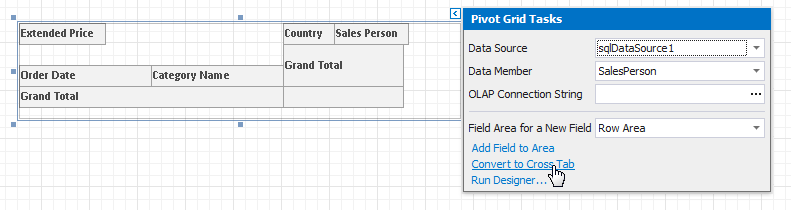
To migrate an existing Pivot Grid control to a new Cross Tab control, click the Pivot Grid's smart tag and select Convert to Cross Tab.
Note that the Cross Tab does not support specific Pivot Grid functionality:
•The Cross Tab cells cannot display pictures (both static and dynamic);
•The Chart control cannot use the Cross Tab as a data source;
•The Cross Tab does not support data headers that are used to manage location of data field headers;
•The Cross Tab does not support the Pivot Grid's predefined aggregate functions.
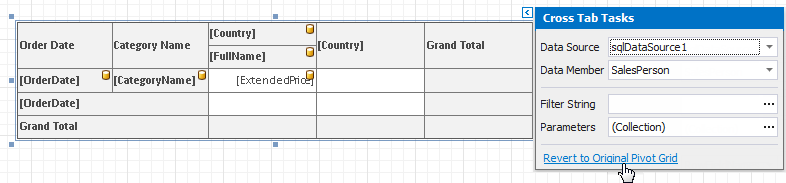
If the conversion result does not suit your requirements, you can restore the Pivot Grid. Click the Cross Tab's smart tag and select Revert to Original Pivot Grid.