|
<< Click to Display Table of Contents >> Variation Types |
  
|
|
<< Click to Display Table of Contents >> Variation Types |
|
Variation summary display types are designed to display absolute and percentage difference between the current value and the previously calculated value for the field.
The absolute variance between the current value and the previously calculated value for the current field is displayed in a cell.
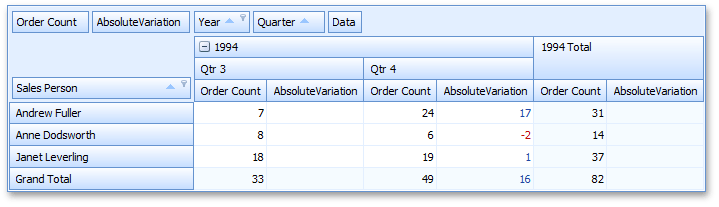
For instance, the Andrew Fuller – Quarter 4 – AbsoluteVariation cell value is calculated as follows:
17 = 24 - 7
24 is the actual sum calculated against the Order Count field for Andrew Fuller – Quarter 4, and 7 is the previous summary value (Andrew Fuller – Quarter 3).
The percentage variance between the current value and the previously calculated value for the current field is displayed in a cell.
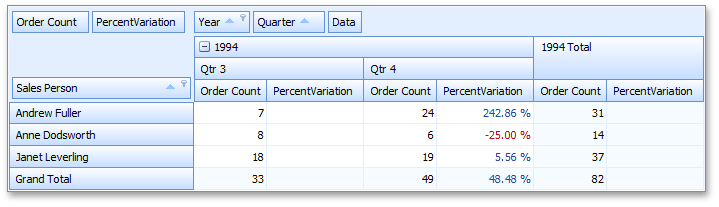
For instance, the Andrew Fuller – Quarter 4 – PercentVariation cell value is calculated as follows:
2.4286 = (24-7)/7
To specify formatting settings, use the data field’s PivotGridFieldBase.CellFormat property.