The Scatter Chart display can display point labels that contain descriptions for data points, and provide tooltips with additional information.
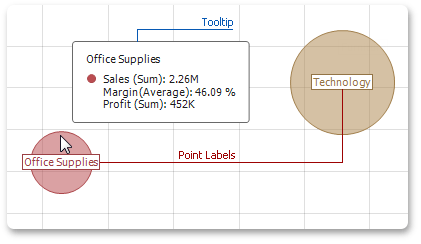
Point Labels
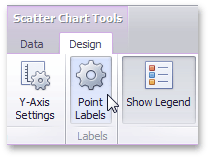
To manage the visibility of point labels, click the Point Labels button in the Design ribbon tab.
In the invoked Point Label Settings dialog, enable the Show point labels check box to show point labels.
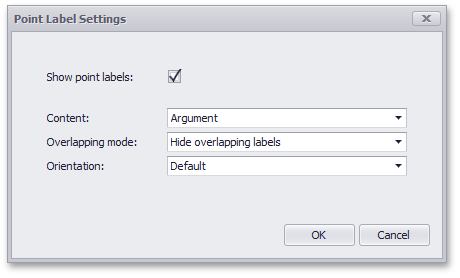
You can specify the following settings for point labels.
Option |
Description |
Content |
Specifies the type of content displayed within point labels. You can select one of the following options. •Values - Point labels show summary values from X and Y-axes. •Argument - Point labels show argument values. •Argument and values - Point labels show argument values and corresponding summary values. •Weight - Point labels show the weight summary value. •Argument and weight - Point labels show the argument value and the corresponding weight summary value. |
Overlapping mode |
Specifies the label overlap mode. The following options are available. •Hide overlapping labels - If two or more labels overlap, some of them are automatically hidden to avoid overlapping. •None - The overlapping resolving algorithm is disabled. •Reposition overlapping labels - The default algorithm to re-position point labels in a random way, and avoid overlapping labels. |
Orientation |
Specifies the orientation of point labels. The following options are available. •Default - A point label is displayed in its default orientation. •Rotate to the Right - A point label is rotated 90 degrees clockwise. •Rotate to the Left - A point label is rotated 90 degrees counter clockwise. |