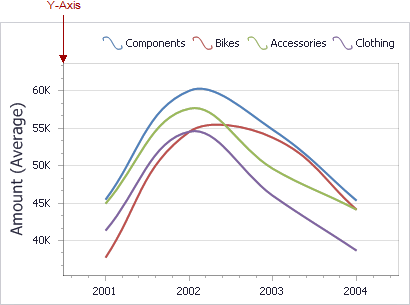
The Y-axis is the numerical axis of values.

 General Settings
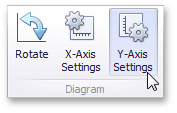
To access the Y-axis settings, use the Y-Axis Settings button in the Diagram section of the Design Ribbon tab (or the ![]() button if you are using the toolbar menu).
button if you are using the toolbar menu).
This will invoke the Y-Axis Settings dialog.
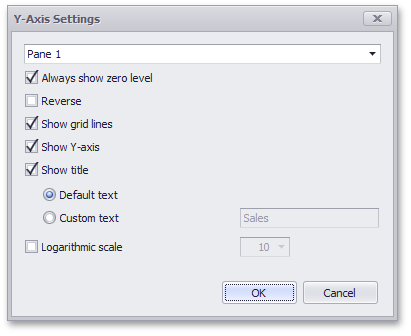
Use the combo box at the top to select the pane for the Y-axis settings you need to edit.
The dialog contains the following settings.
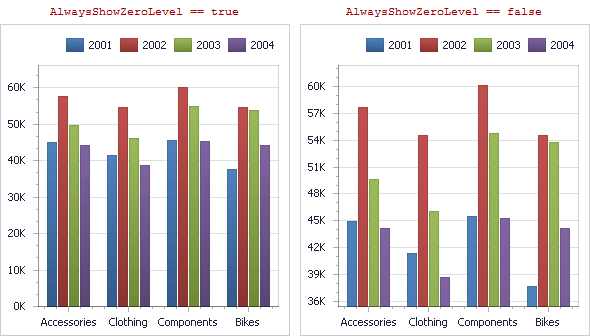
Always show zero level |
Specifies whether or not the axis' zero level is visible. If this option is unchecked, the visible axis range is defined based on the values plotted in the chart.
|
Reverse |
Allows you to reverse the X-axis. If the X-axis is reversed, its values are ordered from top to down. |
Show grid lines |
Allows you to hide and show grid lines for the Y-axis. |
Show Y-axis |
Allows you to hide and show the Y-axis. |
Show title |
Allows you to hide and show the Y-axis title. You can choose whether to use the default text or specify a custom string. |