The Dashboard Designer allows you to bind various dashboard items to data in a virtually uniform manner. To learn more, see the Binding Dashboard Items to Data topic.
The only difference is in the data sections that the required dashboard item has. This topic describes how to bind a Pie dashboard item to data in the Designer.
The Pie dashboard item has the following data sections.
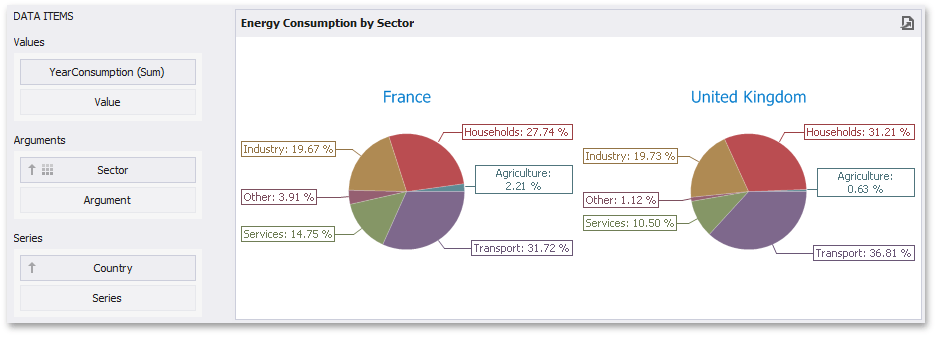
•The Values section contains data items that define the share of pie segments.
•The Arguments section contains data items that provide values used to label pie segments.
•The Series section contains data items whose values are used to label pie charts.
Note
The Pie dashboard item allows you to manage coloring of their measures and dimensions. To learn more, see Coloring.
The Pie dashboard item provides the capability to transpose pie arguments and series. In this case, data items contained in the Arguments section are moved to the Series section, and vice versa.
To transpose the selected Pie dashboard item, use the Transpose button in the Home ribbon tab.