The Dashboard Designer allows you to bind various dashboard items to data in a virtually uniform manner. To learn more, see the Binding Dashboard Items to Data topic.
The only difference is in the data sections that the required dashboard item has. This topic describes how to bind a Gauge dashboard item to data in the Designer.
The Gauge dashboard item has the following data sections.
•The Gauges section contains data items used to calculate values displayed by gauges. Data items are arranged in containers. Each data item container can hold two data items. The first item contains actual data and the second item (optional) contains target data. If both items are provided, gauges show the difference between actual and target values.
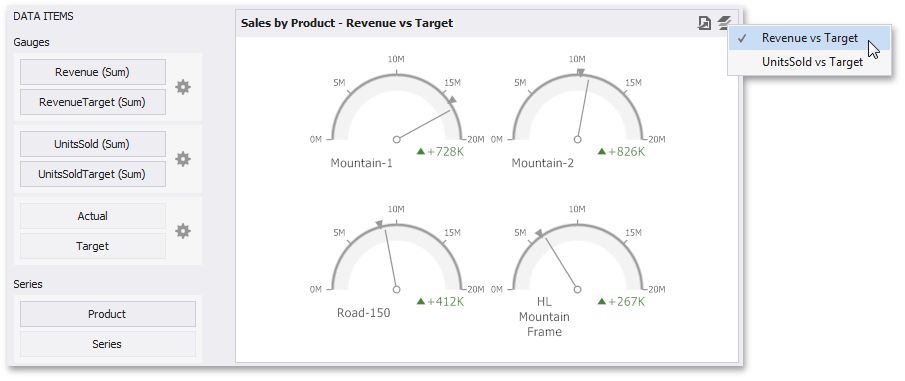
You can fill several data item containers in the Gauges section and use the Values drop-down menu to switch between the provided values. To invoke the Values menu, click the ![]() icon in the dashboard item caption.
icon in the dashboard item caption.
Note
This drop-down menu is available if the Series section is not empty. Otherwise, a separate gauge is created for each data item container, and all gauges are displayed simultaneously.
•The Series section contains data items whose values are used to label gauges.