This document describes the features that enable interaction between the Range Filter and other dashboard items. These features include Master Filtering.

 Master Filtering
The Dashboard allows you to use any data-aware dashboard item as a filter for other dashboard items (Master Filter). To learn more, see the Master Filtering topic, which describes filtering concepts common to all dashboard items.
Master filtering is always enabled for the Range Filter dashboard item. This Range Filter displays a chart with selection thumbs that allow you to filter out values displayed along the argument axis.

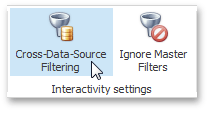
To enable filtering across data sources for the Range Filter, use the Cross-Data-Source Filtering button in the Data Ribbon tab.

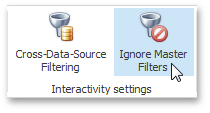
You can enable/disable ignoring of other master filter items using the Ignore Master Filters button in the Data Ribbon tab.

Predefined Periods
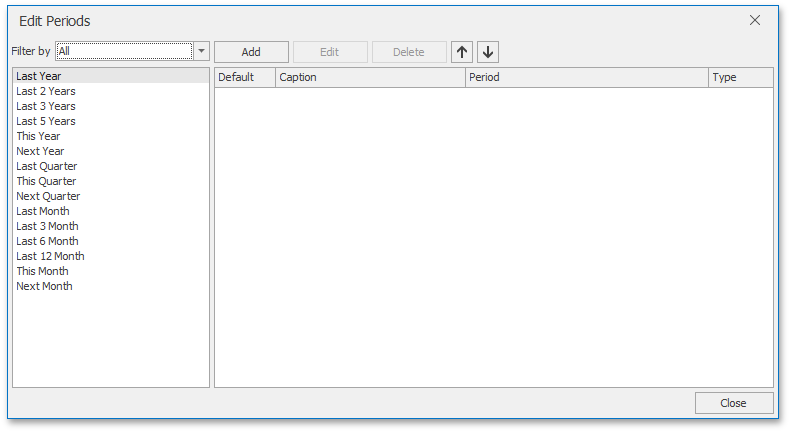
The Range Filter dashboard item allows you to add a number of predefined date-time periods that can be used to perform a selection (for instance, year-to-date or quarter-to-date). To add a period, click the Options button (the ![]() icon) next to the Argument placeholder or use the Edit Periods button in the ribbon's Design tab. This invokes the Edit Periods dialog.
icon) next to the Argument placeholder or use the Edit Periods button in the ribbon's Design tab. This invokes the Edit Periods dialog.

To add the predefined period from the left pane, double-click the required period.

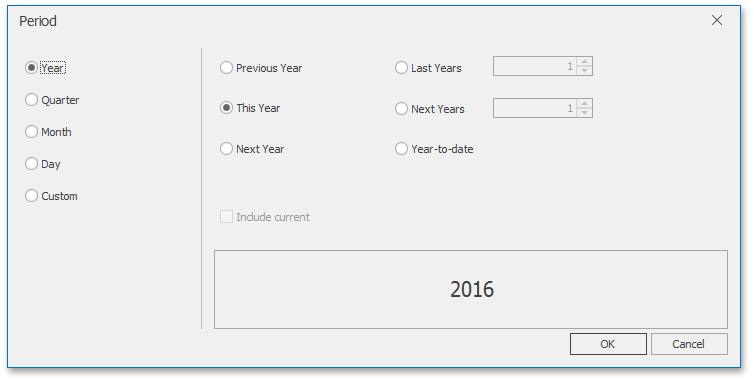
If necessary, you can customize the selected period by clicking the Edit button in the Edit Periods dialog. This invokes the Period dialog.

This dialog allows you to add the Year, Quarter, Month, Day or Custom periods with specific settings.