Overview
Once the Graphs have been plotted they can be customized and manipulated using the graph toolbar. Advanced customization can be applied to an individual Graph using the graphing toolbar.
Toolbar
|
Title: Sets the graph title and sub-title.
Plotting Method:
▪Bar Stacked: 'Yes' and 'No' bars is set the values they are representing.
▪Bar Chart: One column position of data is represented in bars
▪Control Chart: Data plotted over a period of time
▪Pie Chart: One column position of data is represented in slices
▪Pareto chart: Represents frequency/accumulation of totals
Data Points: Show or hide data points plotted on the graph.
Legends: Show or hide legends.
Label Orientation: Set how you want the labels to be oriented for the graph:
▪Horizontal
▪Vertical
▪Slanted
Legend Position: Set where you want the legends to be positioned on the graph. If you have multiple graphs on a canvas, first click on the graph to make it active.
Reset Projection: If you have changed the orientation of the graph, you can reset it to the original setting using this option.
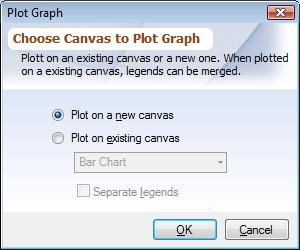
Choose canvas to plot graphs: Plot on an existing canvas or a new one. When plotting on an existing canvas, legends can be merged.
|
