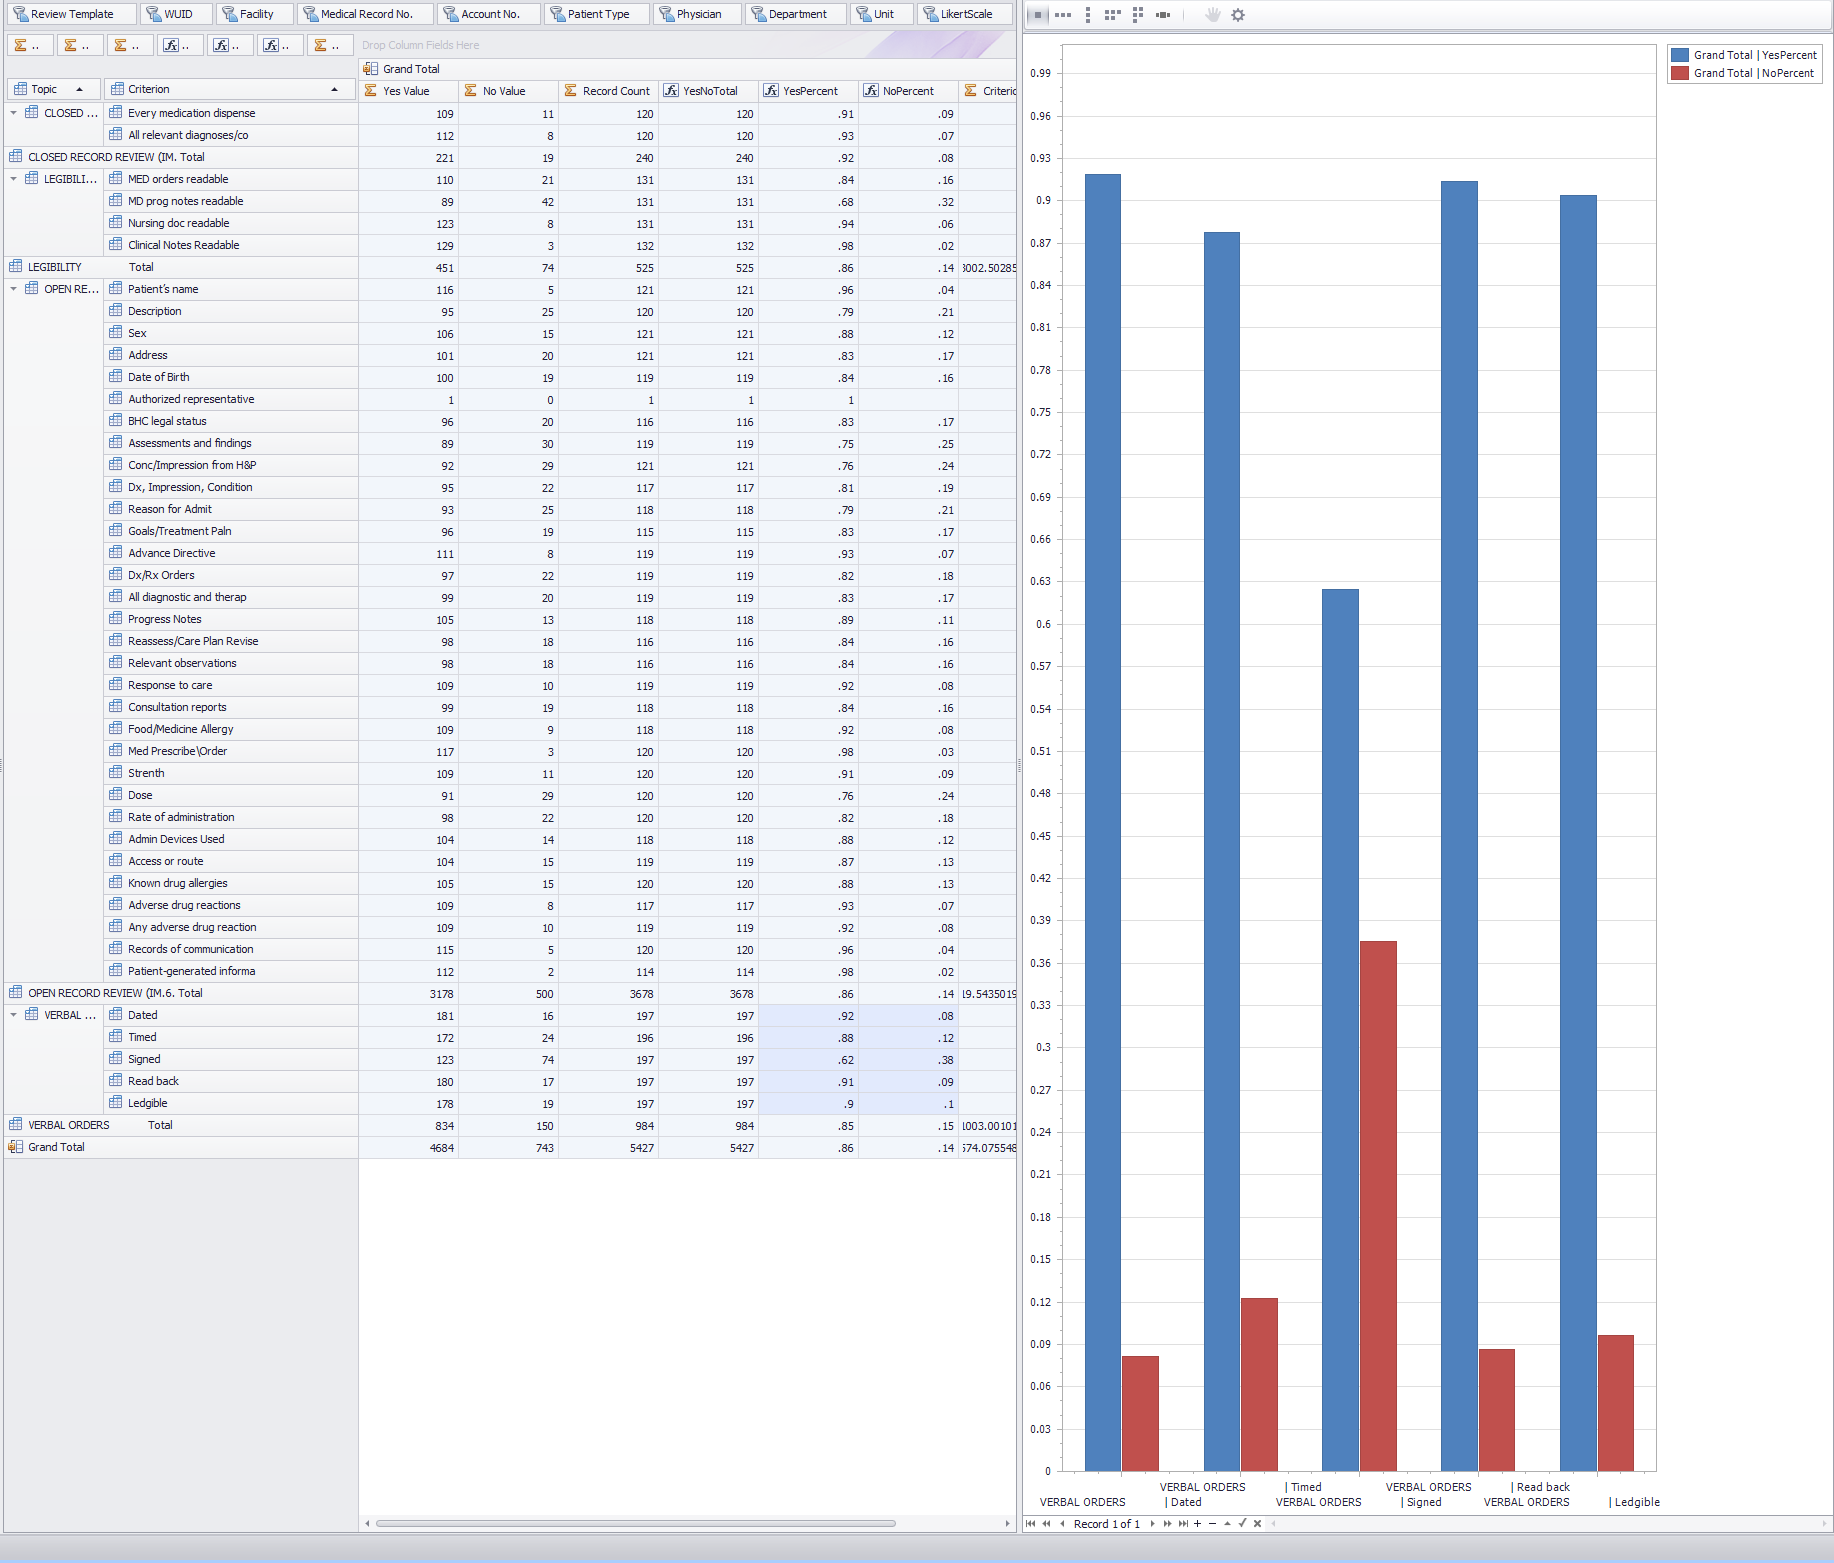
A unique feature of the analyzer is the ability to graph your data simply by highlighting the data to graph. For all selection functions see the topic entitled Analyzer/Pivot Grid. The figure below shows a bar chart reflecting the data that is selected in the analyzer.