The enhanced analyzer component of Plato Data Analyzer is arguably the most useful and powerful of the suite of tools contained within the program. All data retrieved via the query will be available in an analyzer for dynamic analysis, aggregation, and charting. Analyzers intelligently determine which fields are numeric fields and add these to the data section of the analyzer. Non numeric fields are cast as Dimensions under which data may be subcategorized ad infinitum. The analyzer shown below contains the fields and data that was retrieved via the query.
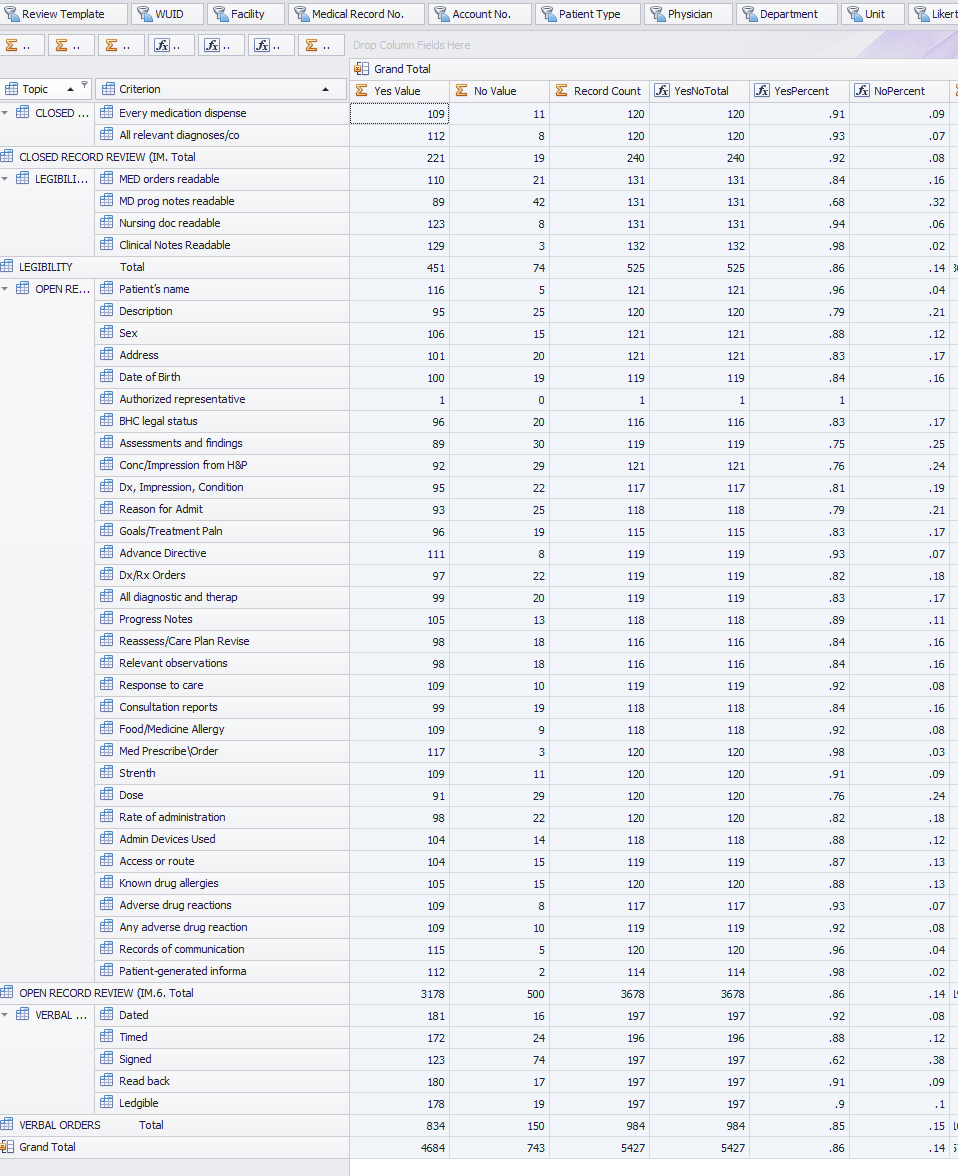
Note that the fields (Review Template, Physician, etc.) are shelved along the top of the analyzer while the numeric data (YesValue, NoValue, etc) is contained in the actual data pane, In the figure above, only the Grand Total is showing as no shelved fields are present in the Row or Column area. To drill down on data drag fields from the shelf or from the Field Chooser into a row or column area to see data re aggregated. In our case, Topic/Criterion is now placed in the row area to show a new breakdown.
To further breakdown the data, simply drag the desired field data to either row or column container. You may also 'shelve' numeric data fields by dragging them from the Field Chooser or from the Data Field (left of the Column area) area of the analyzer. If it is not apparent what the data field name is, hover the mouse over it and a tooltip hint will display the field name.
Context Sensitive Menu
To display a context sensitive menu that give additional control over the views, right click on various areas of the analyzer, e.g. data area, row area, column area, field object, etc.
Drill Down
To drill down into data that is represented by that cell. A floating Data Table will then appear displaying the records that made up the cell aggregate.
Sub Toolbar
Note: Some sub toolbar button functions may be executed by the buttons on the PDA Professional main toolbar.
Expression Editor
Invokes the analyzer expression. See the topic on Expression Editor for more details.
Print Analyzer
This invokes the Print Preview window for the Analyzer that allows for many options in addition to printing. Exporting options are also available. For an in depth discussion on the Print Preview window see the topic Analyzer Print Preview.
Print Chart
This invokes the Print Preview window that allows for many options in addition to printing. Exporting options are also available. For an in depth discussion on the Print Preview window see the topic Chart Print Preview.
Export Analyzer
Exports the current analyzer view to an excel worksheet or a PDF document preserving the formatting.
Expand All
Expands all row and column area groups.
Collapse all
Collapses all row and column groups.
Totals Off
Hides the totals associated with each dimension breakdown.
Totals On
Shows the totals associated with each dimension breakdown.
Show Top
Allows for displaying only top N entries sorted by a selected field. When invoked the following dialog will appear.
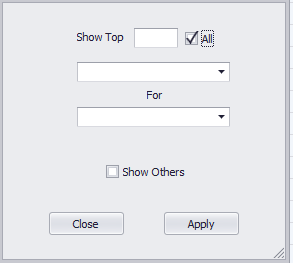
For Show Top, enter the number of entries to show top for.
The first drop down combo box contains the list of numeric data fields. The second drop down combo box contains the list of non numeric fields. The pseudo logic for this dialog is
Show top [n] [numericdata] for [fieldname]
The Show Others check box if checked will aggregate all remaining data under an 'Others' label.
To remove the Show Top function from the Analyzer, invoke the Show Top dialog, click All then Apply.
Suspend Charting
A toggle to determine whether Charting is rendered immediately while dragging the mouse across data cells.
Series Breakdown
Determines whether individual series or one auto created series is available to the Chart Wizard.
Chart Wizard
Invokes the Chart Wizard dialog where numerous setting may be set against the active chart.