|
<< Click to Display Table of Contents >> Bar Series |
  
|
|
<< Click to Display Table of Contents >> Bar Series |
  
|
Bar series visualize data using rectangular bars with lengths proportional to the values that they represent.
The following types of Bar series are available.
•Bar
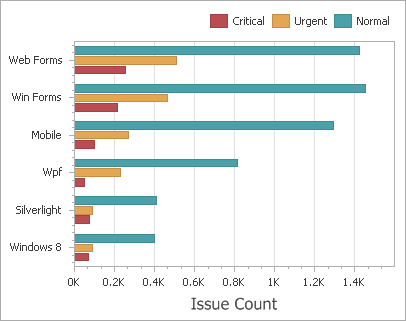
Bar series can be used to compare values across categories.

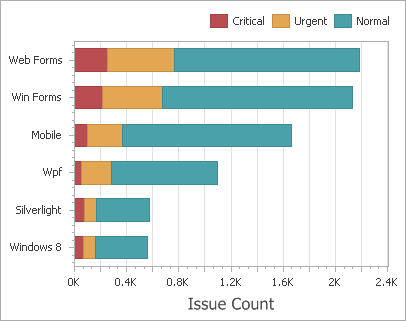
Stacked Bar series show the contribution of individual categories to the whole.

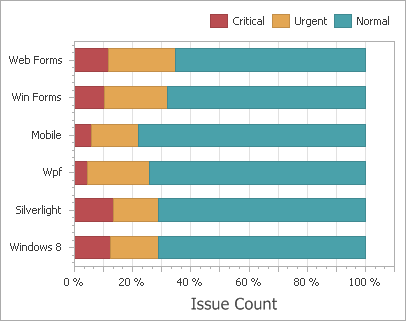
Full-Stacked Bar series allow you to compare the percentage that each value contributes to a total across categories.
