|
<< Click to Display Table of Contents >> Multiple Analyzer Views |
  
|
|
<< Click to Display Table of Contents >> Multiple Analyzer Views |
|
It is possible to host multiple 'snapshots' of analyzers within the same analyzer environment. This is useful if you want to see different aggregations for the same data against the same fields.
This is done by using the navigation bar under the chart section.
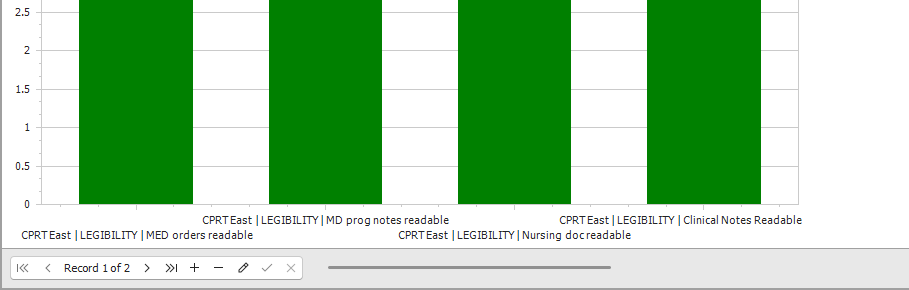
The image below shows that there are two snapshots of the analyzer in the environment each with their respective charts. Moving the navigator to the next record will cause the analyzer to reconfigure itself back to its earlier stage. For example the analyzer for record 1 would be as follows:
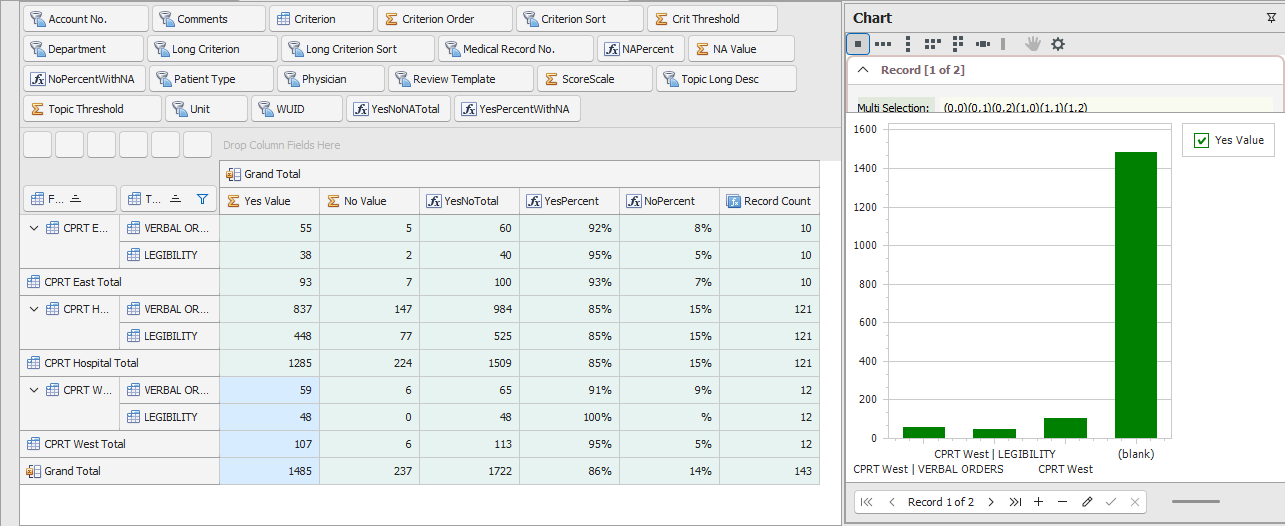
Note what is highlighted is graphed on the chart. If we click to go to record 2 we might have the following.
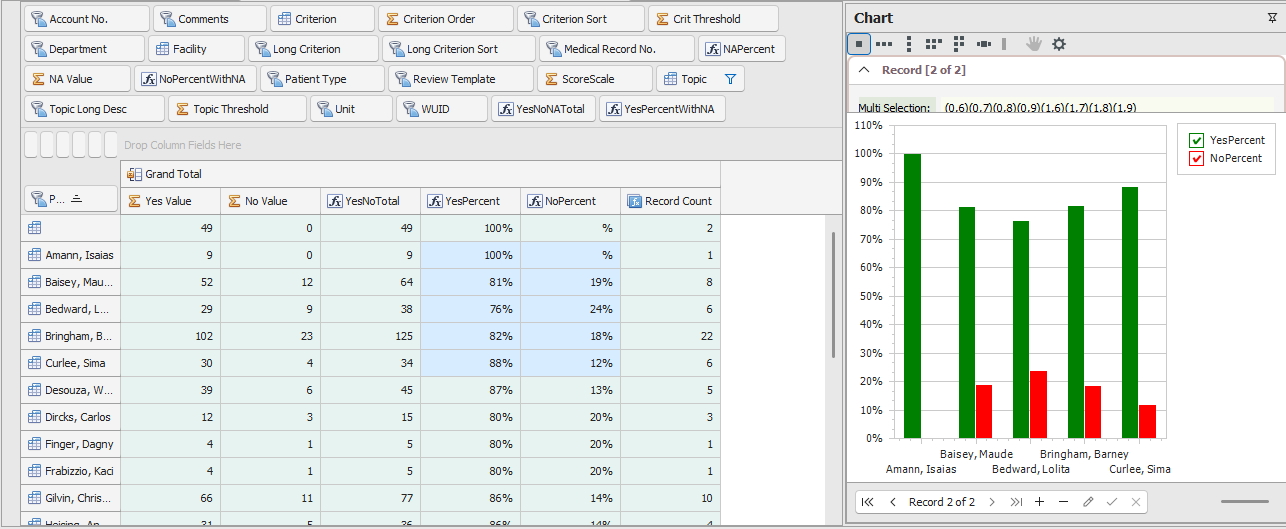
The same analyzer with the same data is displayed albeit with different rows and column information.
Going back to the first record will reconfigure the analyzer with the previous layout.
Analyzer snapshots may be added, deleted, and modified using the navigation bar.
An analyzer must have at least one record.