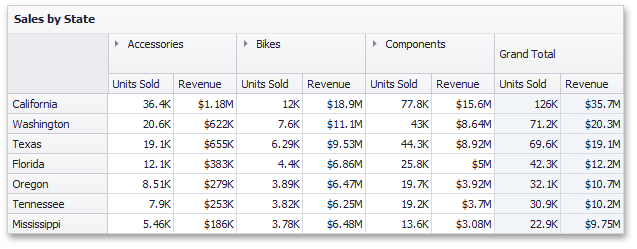
The Pivot dashboard item displays a cross-tabular report that presents multi-dimensional data in an easy-to-read format.

This section consists of the following subsections:
Explains how to supply the Pivot dashboard item with data.
Describes features that enable interaction between the Pivot and other dashboard items.
Describes the conditional formatting feature that provides the capability to apply formatting to cells whose values meet the specified condition.
Describes the Pivot dashboard item's layout options.
Describes how to specify whether to expand column/row groups by default.