Range series are generally used to show variations in a specified time range like temperature, price, etc.
The following types of Range series are available.
Data Binding Specifics
A range series is a space between two simple series displayed as a filled area (Range Area) or bars that stretch from a point in one series to the corresponding point in the other (Range Bar). Thus, you need to provide two measures instead of one to display a range series.
•Value 1 - a measure against which the first set of values is calculated.
•Value 2 - a measure against which the second set of values is calculated.
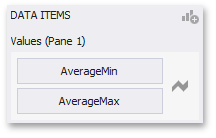
When you select the Range Bar or Range Area series type in the Designer, the DATA ITEMS area displays two data item placeholders. Drag and drop the required measures to corresponding placeholders.
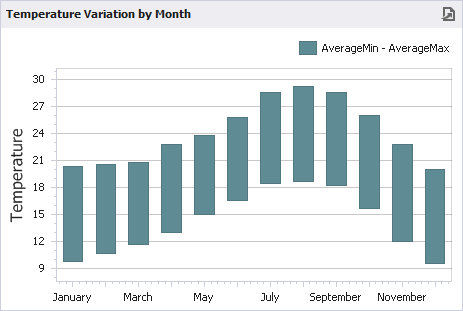
 Range Bar
Range Bar series are similar to Bar series except that they are drawn between a range of values.
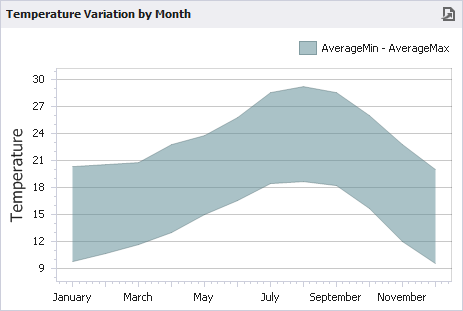
 Range Area
Range Area series are similar to Area series except that their areas are filled between a range of values.