Overview
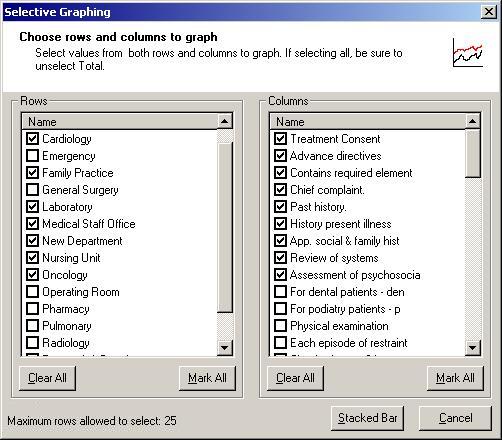
Data Analyzer does not allow you to select non-continuous rows or columns. Thus you cannot plot Graphs for rows or columns which are not adjacent to each other. To accomplish this, use this option.
|
Steps
To access this dialog, right-click on any of the Data Items in the row position, and choose the Graph you want to plot. The rows section of this dialog lists the rows of Data Analyzer Data Items. The columns list the columns of Data Analyzer Data Items. Check the items you want to plot and uncheck the ones you do not wish to . Click the 'Graph' button to plot the Graph.
▪Clear All: Unchecks all the entries for that list.
▪Mark All: Checks all the entries for that list.
