Dashboard for Desktop > Dashboard Designer > Conditional Formatting > Top-Bottom
The Top-Bottom format conditions allow you to highlight a specific number of topmost/bottommost values. You can specify this number as an absolute or percent value.
The following condition types are supported for measures.
Format Condition |
Description |
Can be applied to |
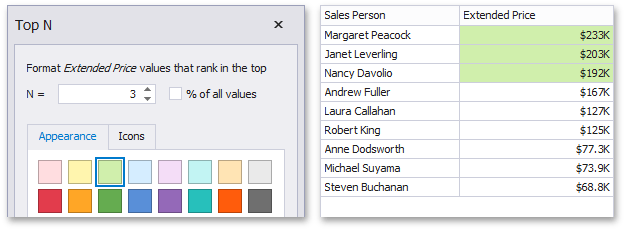
The Top N format condition allows you to apply formatting to elements whose values are ranked at the top. For instance, the following image displays a Grid dashboard item whose top 3 Extended Price values filled in green.
|
Measures |
|
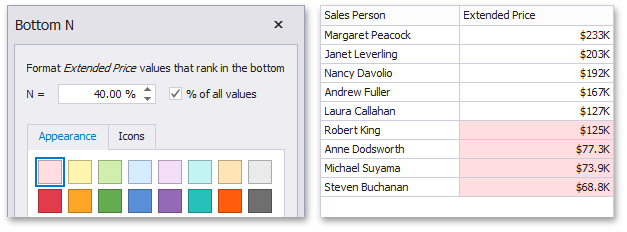
The Bottom N format condition allows you to apply formatting to elements whose values are ranked at the bottom. For instance, the following image displays a Grid dashboard item whose bottom 40 percent Extended Price values are filled in red.
|
Measures |
Copyright (c) 1998-2016 Developer Express Inc. All rights reserved.
Send Feedback on this topic to DevExpress.