Dashboard for Desktop > Dashboard Designer > Dashboard Items > Scatter Chart > Legend
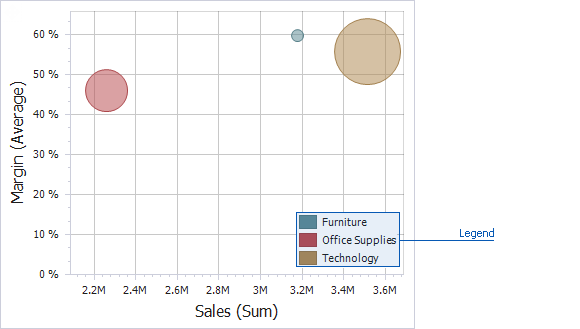
A legend is an element of a scatter chart that identifies chart points (for instance, colored points corresponding to argument values).
This topic describes how to customize various legend settings.

 Visibility
You can specify whether or not a chart should display a legend.
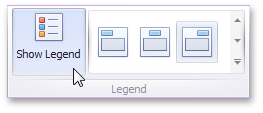
In the Designer, use the Show Legend button in the Legend section of the Design Ribbon tab (or the ![]() button if you are using the toolbar menu).
button if you are using the toolbar menu).
Position and Orientation
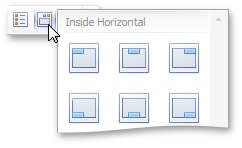
To specify the legend's position and orientation, select one of the predefined options from the gallery in the Design Ribbon tab.

If you are using the toolbar menu, use the ![]() button to invoke this gallery.
button to invoke this gallery.
Copyright (c) 1998-2016 Developer Express Inc. All rights reserved.
Send Feedback on this topic to DevExpress.