Dashboard for Desktop > Dashboard Designer > Dashboard Items > Scatter Chart > Orientation
You can rotate the Scatter Chart so that the X-axis becomes vertical, and the Y-axis becomes horizontal.
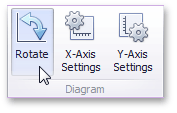
To rotate a Chart in the Designer, use the Rotate button in the Diagram section of the Design Ribbon tab (or the ![]() button if you are using the toolbar menu).
button if you are using the toolbar menu).
Copyright (c) 1998-2016 Developer Express Inc. All rights reserved.
Send Feedback on this topic to DevExpress.