Interface Elements for Desktop > Report Designer > Report Designer for WPF > Interface Elements > Control Toolbox
The Control Toolbox contains all available report controls and allows end-users to add them to the report being edited. Report controls can display both static and dynamic information of different kinds (simple or formatted text, pictures, tables, etc.) and adjust a report layout (organize controls within panels, insert page brakes, etc.)
The available report controls can be divided into the following categories.
To learn how to add a control from the Toolbox to a report, see the Adding Controls to a Report section.

 General Content
The following controls are most commonly used to display data in a report.
Label |
Check Box |
Rich Text |
Picture Box |
Table |
Barcode |
Zip Code |
Gauge |
Extended Data
The following controls are connected to data individually, without accessing a report's data source.
Chart |
Pivot Grid |
Sparkline |
Report Layout
The following controls allow you to draw shapes in a report and customize the report layout.
Line |
Shape |
Page Break |
Cross-Band Line |
Cross-Band Box |
Panel |
Subreport |
Document Statistics
The dynamic content of the following controls is not obtained from a data source.
Page Info |
Adding Controls to a Report
To add a control from the Toolbox to a report, do one of the following.
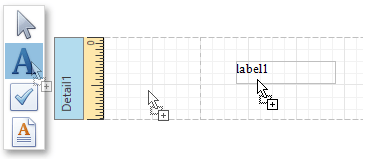
•Double-click an item in the Toolbox to create the corresponding control at the default position.
•Drag-and-drop an item from the Toolbox onto the required position within a report.
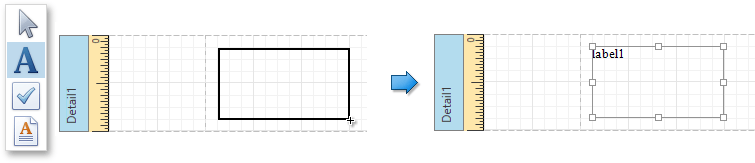
•Select an item in the Toolbox, and then indicate the bounding rectangle by holding down the left mouse button.
If you need to perform selection, re-arranging or resizing operations, select the Pointer item (![]() ).
).
See Also
Create and Delete Report Elements
Binding Report Controls to Data
Copyright (c) 1998-2016 Developer Express Inc. All rights reserved.
Send Feedback on this topic to DevExpress.