Dashboard for Desktop > Dashboard Designer > Aggregations > Aggregate Functions
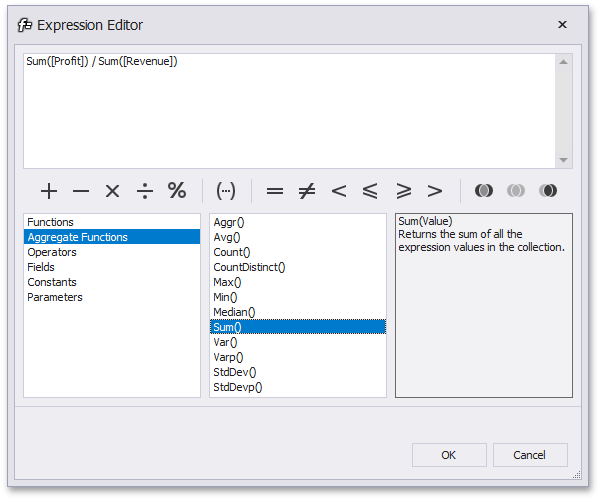
The Dashboard Designer allows you to perform aggregations when constructing a calculated field expression. This allows you to evaluate calculated fields on a summary level.
In the Dashboard Designer, you can use the following set of predefined aggregate functions.
Function |
Description |
Aggr(SummaryExpression, Dimensions) |
Aggregates underlying data using the detail level specified by a predefined set of dimensions and a specified summary function. To learn more, see Intermediate Level Aggregations. |
Avg(Value) |
Returns the average of all the values in the expression. |
Count() |
Returns the number of values. |
CountDistinct(Value) |
Returns the number of distinct values. |
Max(Value) |
Returns the maximum value across all records. |
Min(Value) |
Returns the minimum value across all records. |
Median(Value) |
Returns the median of the values. |
Sum(Value) |
Returns the sum of all values. |
Var(Value) |
Returns an estimate of the variance of a population where the sample is a subset of the entire population. |
Varp(Value) |
Returns the variance of a population where the population is the entire data to be summarized. |
StdDev(Value) |
Returns an estimate of the standard deviation of a population where the sample is a subset of the entire population. |
StdDevp(Value) |
Returns the standard deviation of a population where the population is the entire data to be summarized. |
These functions can be used for all types of numeric fields. After creating such calculated fields, you can use them as measures contained in an OLAP cube.
Copyright (c) 1998-2016 Developer Express Inc. All rights reserved.
Send Feedback on this topic to DevExpress.