Dashboard for Desktop > Dashboard Designer > Dashboard Items > Chart > Series > Bar Series
Bar series visualize data using rectangular bars with lengths proportional to the values that they represent.
The following types of Bar series are available.
•Bar


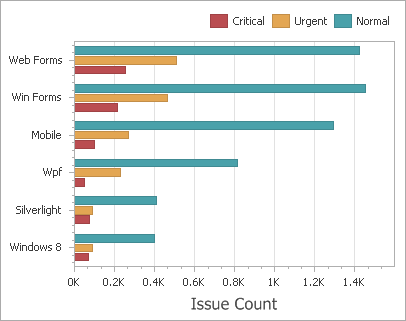
 Bar
Bar
Bar series can be used to compare values across categories.
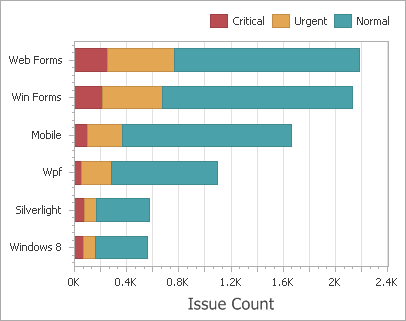
 Stacked Bar
Stacked Bar series show the contribution of individual categories to the whole.
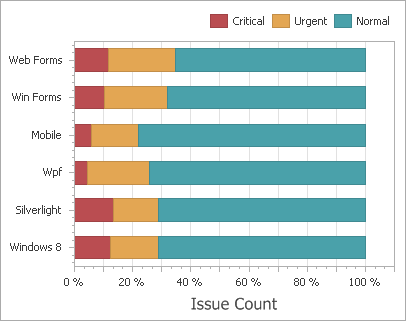
 Full-Stacked Bar
Full-Stacked Bar series allow you to compare the percentage that each value contributes to a total across categories.
Copyright (c) 1998-2016 Developer Express Inc. All rights reserved.
Send Feedback on this topic to DevExpress.