Dashboard for Desktop > Dashboard Designer > Dashboard Items > Choropleth Map > Map Coloring > Delta
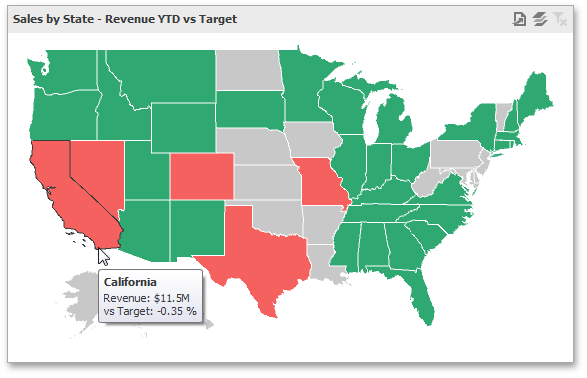
The Choropleth Map allows you to indicate the difference between the actual and target values of a particular parameter. This difference is called delta.

 Delta Options
To specify delta indication settings, click the Options button next to the data item container.

This invokes the Choropleth Map Options dialog. When the map type is set to Delta, this dialog contains the following settings.
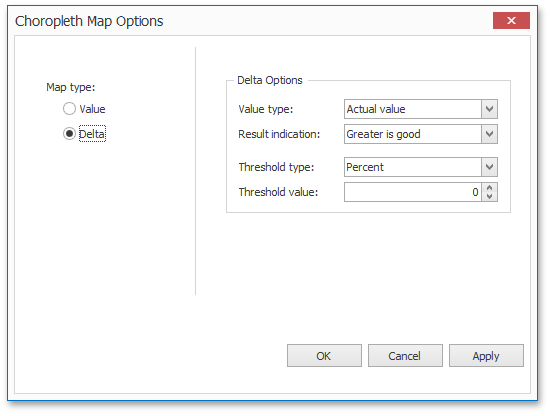
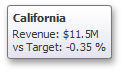
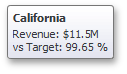
•Value type
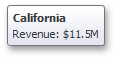
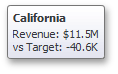
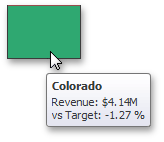
You can specify which values to display within map tooltips. Use the Value type combo box to select the value that will be displayed as the delta value.
Actual value |
Absolute variation |
Percent variation |
Percent of target |
|
|
|
|
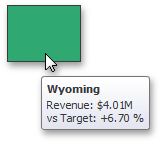
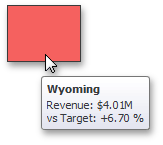
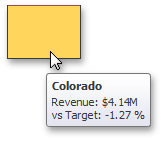
•Result Indication
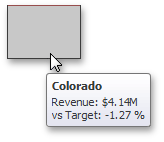
You can specify the condition that will be used to select the indicator color. To do this, use the Result indication combo box.
Greater is good |
Less is good |
Warning if greater |
Warning if less |
No indication |
|
|
|
|
|


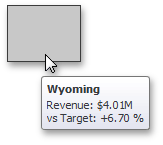
•Threshold type and Threshold value
You can specify that a required indicator should only be displayed when the difference between the actual and target values exceeds a specified value. For instance, the actual value exceeds the target value by 10%, or by $2K.
Use the Threshold type combo box to select whether you wish to specify the threshold in percentage values or in absolute values. Then use the Threshold value box to specify the threshold value.
Copyright (c) 1998-2016 Developer Express Inc. All rights reserved.
Send Feedback on this topic to DevExpress.