|
<< Click to Display Table of Contents >> Grouping |
  
|
|
<< Click to Display Table of Contents >> Grouping |
  
|
The Dashboard Designer allows you to group dimension values and display summaries for entire groups rather than individual values.
You can arrange dimension values in groups of different sizes by specifying the appropriate group interval. For instance, date-time values can be grouped by years, months, quarters, etc.
This topic lists the supported text and date-time group intervals, and describes how to change the group interval.
The following sections are available.
String values support the following grouping intervals.
•No Grouping - each value is displayed "as is".
•Alphabetical - values are grouped alphabetically (e.g., A, B, C, ... Z).
Date-time values support the following group intervals.
Examples in the table below are formatted using the default settings. To learn how to customize format settings, see Formatting Data.
Group interval |
Description |
Examples |
Year |
Values are grouped by the year. |
2010, 2011, 2012 |
Quarter |
Values are grouped by the quarter. |
Q1, Q2, Q3, Q4 |
Month |
Values are grouped by the month. |
January, February, March, ... December |
Day |
Values are grouped by the day of the month. |
1, 2, 3, ... 31 |
Hour |
Values are grouped by the hour. |
0, 1, 2, ... 23 |
Minute |
Values are grouped by the minute. |
0, 1, 2, ... 59 |
Second |
Values are grouped by the second. |
0, 1, 2, ... 59 |
Day of the Year |
Values are grouped by the day of the year. |
1, 2, 3, ... 365 |
Day of the Week |
Values are grouped by the day of the week. |
Sunday, Monday, Tuesday, ... Saturday |
Week of the Year |
Values are grouped by the week of the year. |
1, 2, 3, ... 52 |
Week of the Month |
Values are grouped by the week of the month. |
1, 2, 3, 4, 5 |
Week-Year |
Values are grouped by the date of the first day of the week (uses culture settings). |
7/1/2018, 7/8/2018, 7/15/2018, ... 11/4/2018, 11/11/2018, 11/18/2018, ... |
Month-Year |
Values are grouped by the year and month. |
January 2012, February 2012, ... December 2012, January 2013, ... |
Quarter-Year |
Values are grouped by the year and quarter. |
Q3 2012, Q4 2012, Q1 2013, Q2 2013, ... |
Day-Month-Year |
Values are grouped by date. |
3/4/2012, 3/5/2012, 3/6/2012, ... |
Date-Hour |
Values are grouped by date with the hour value. |
3/4/2012 0:00 AM, 3/4/2012 1:00 AM, 3/4/2012 2:00 AM, ... |
Date-Hour-Minute |
Values are grouped by date with the hour and minute values. |
3/4/2012 0:00 AM, 3/4/2012 0:01 AM, 3/4/2012 0:02 AM, ... |
Date-Hour-Minute-Second |
Values are grouped by date with the hour, minute and second values. |
3/4/2012 0:00:00 AM, 3/4/2012 0:00:01 AM, 3/4/2012 0:00:02 AM, ... |
Exact Date |
Each value is displayed "as is". |
2009, Q2 2009, 6/15/2009 1:45:30 PM, ... |
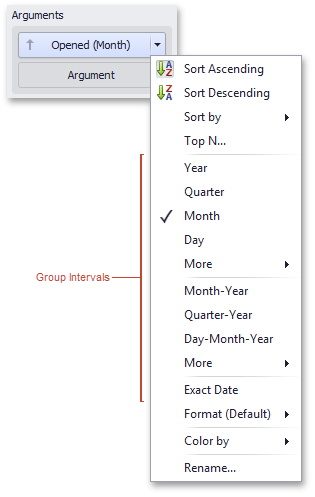
To specify the group interval in the Designer, invoke the data item menu and select the desired group interval. Less common group intervals are organized in the More submenus.

•