Charts associated with an analyzer are displayed in a grid to the right. Navigation and display through the charts are carried out by the navigation bar and Grid View buttons respectively. The navigation bar contains the following buttons from left to right.
![]()
Move to beginning
Moves the focus to the first chart in the series.
Previous Page
Moves to the previous page in the chart series
Previous
Moves to the previous chart in the series
Label
Displays the chart's index within the total count of charts
Next
Moves to the next chart in the series
Next Page
Moves to the next page in the chart series
Append
Add a new blank chart to the series. The blank chart may then be used as the chart target for the selected data in the analyzer.
Delete
Deletes the currently focused chart from the chart series.
Edit
Not used.
End Edit
This button expects to be clicked whenever a new chart is added via the Append function. Not clicking this button results in the chart being discarded when the analyzer is closed.
Cancel Edit
Not used.
The buttons for manipulating the display options of the chart grids are as follows.
![]()
Full screen
Makes the currently focused chart occupy the full grid display area.
One row
Displays the charts in a single centered row.
One column
Displays the charts in a single centered column.
Row view
Displays the charts in rows, 2 charts per row max.
Column View
Displays the charts in columns, 2 charts per column max.
Carousel
Displays the charts in a carousel mode.
Drag
Not used.
Configure.
Not used.
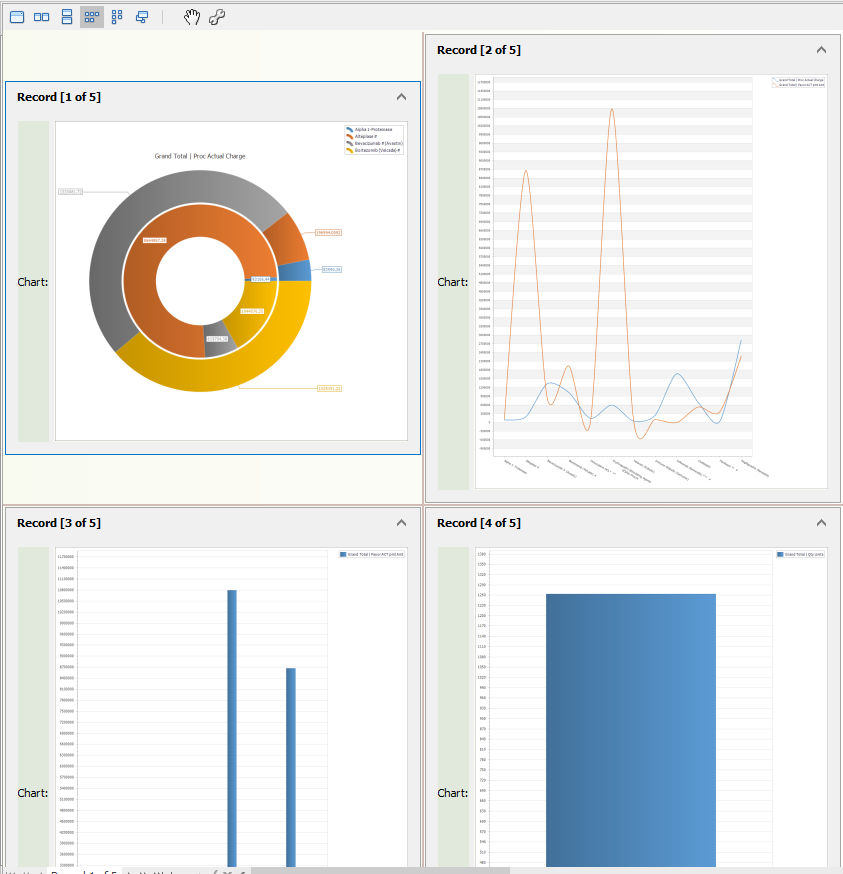
The following figure shows 5 charts in a 2x2 row. Focusing each chart readjust the analyzer view to be what it was that generated the chart.