The analyzer component of Plato Analysis is arguably the most useful and powerful of the suite of tools contained within the program. All data retrieved via the query will be available in an analyzer for dynamic analysis, aggregation, and charting. Analyzers intelligently determine which fields are numeric fields and add these to the data section of the analyzer. Non numeric fields are cast as Dimensions under which data may be subcategorized ad infinitum. The analyzer shown below contains the fields and data that were retrieved via the query.
A unique feature of the analyzer is the ability to graph your data simply by highlighting the data to graph. For all selection functions see the topic entitled Analyzer/Pivot Grid. The figure below shows a bar chart reflecting the data that is selected in the analyzer.
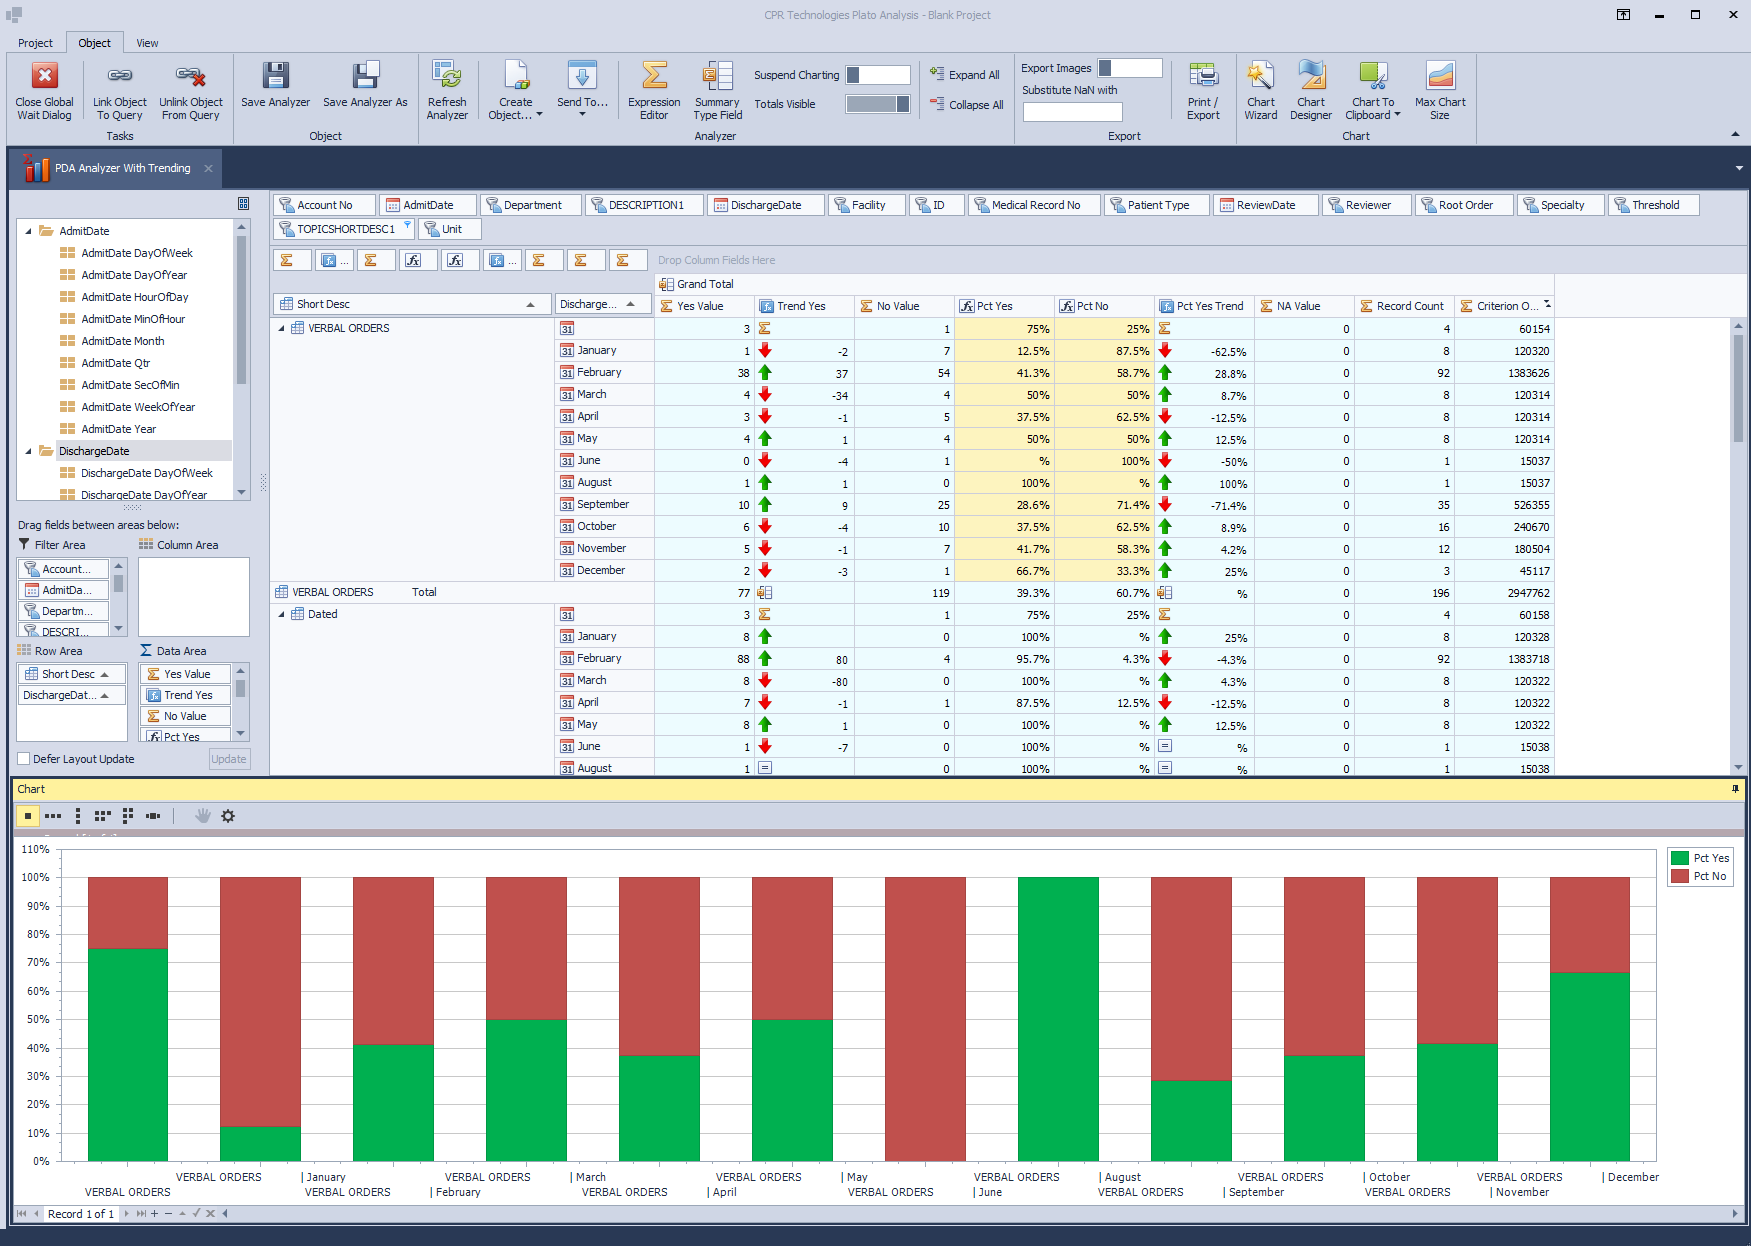
Note that the fields (Account #, Department, etc.) are shelved along the top of the analyzer while the numeric data (Yes , No, Pct*, etc) is contained in the actual data pane, In the figure above, only the Grand Total is showing as no shelved fields are present in the Column area. To drill down on data drag fields from the shelf or from the Field Chooser into a row or column area to see data re aggregated. In our case, the Verbal Orders topic is now placed in the row area to show a new breakdown.
To further breakdown the data, simply drag the desired field data to either row or column container. You may also 'shelve' numeric data fields by dragging them from the Field Chooser or from the Data Field (left of the Column area) area of the analyzer. If it is not apparent what the data field name is, hover the mouse over it and a tooltip hint will display the field name.
To display a context sensitive menu that give additional control over the views, right click on various areas of the analyzer, e.g. data area, row area, column area, field object, etc.
Selecting the Analyzer tab will add the toolbar section to the Object Tab of the main ribbon toolbar.

Link Object To Query
Associates the Analyzer with a query that may be used for refreshing the contents of the Analyzer.
Unlink Object From Query
Removes the associated query from the Analyzer.
Save Analyzer / Save Analyzer As
Saves the Analyzer for later recall
Refresh Analyzer
Refreshes the Analyzer with new data from the associated query. This preserves analyzer formats and filters.
Create Object...
Uses the contents of the Analyzer to create a new DataGrid or Dashboard
Send To...
Sends the contents of the Analyzer to an already open Data Grid or Dashboard
Invokes the Expression Editor for creating Calculated Analyzer Columns
Invokes the Summary Type Dialog for creating Summary Types Analyzer Columns
Suspend Charting
A toggle to determine whether Charting is rendered immediately while dragging the mouse across data cells.
Totals Visible
Toggles the totals visibility associated with each dimension breakdown.
Print / Export
This invokes the Print Preview window that allows for many options in addition to printing. Exporting options are also available. For an in depth discussion on the Print Preview window see the topic Print Preview.
Invokes the Chart Wizard or Chart Designer dialog where numerous setting may be set against the active chart.
Chart to Clipboard
Copies the active chart onto the clipboard. Suitable for inclusion into a third party application, e.g. Microsoft Excel. The image may also be used in Plato Analysis Dashboards.
Max Chart Size
Causes the chart to cover all available space.


