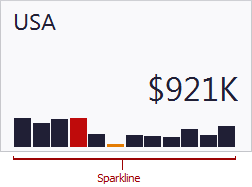
Sparklines can be used in cards to visualize the variation of actual (or target) values over time.
Data Binding Specifics
To display a sparkline within a card, provide a date-time dimension whose data will be used to visualize values over time.
Note
To learn how to provide actual (or target) values for a card, see the Providing Data topic.
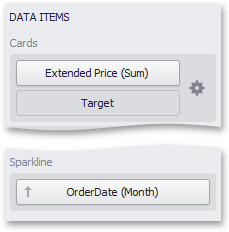
Note that if you have provided both actual and target values, a sparkline visualizes the actual value's variation over time.
Sparkline Options
You can control sparkline appearance settings using the Card Settings dialog. To invoke this dialog, click the options button (the ![]() icon) displayed next to the data item container.
icon) displayed next to the data item container.
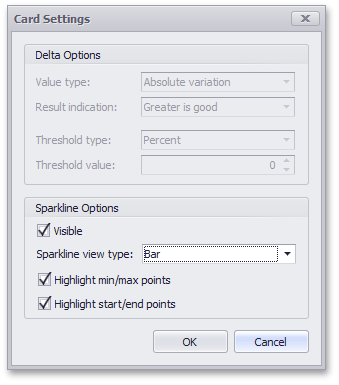
In this dialog, you can control various settings that affect how the sparkline is displayed within a card.
Sparkline Options |
Description |
Visible |
Specifies whether or not to show a sparkline within a card. |
Sparkline view type |
Defines the view type of a sparkline. Sparkline view types include Area, Line, Bar and Win/Loss. |
Highlight min/max points |
Specifies whether or not to highlight the minimum/maximum points of a sparkline. |
Highlight start/end points |
Specifies whether or not to highlight the start/end points of a sparkline. |