Overview
Data to be displayed in Data Analyzer can be filtered to run for a given set of parameters e.g. date range, particular practitioner. You can also choose the columns and row that should be displayed in the Data Analyzer from the 'Break On' section. These customized parameters can be saved in a template from Managing Report And Analyzer Templates.
Filter Tab
|
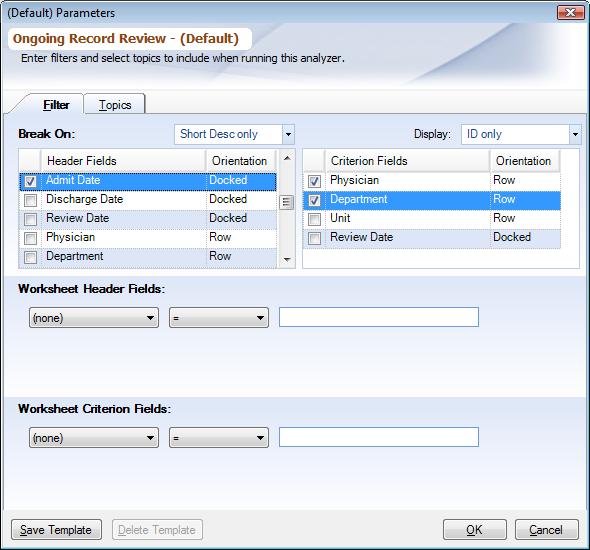
Break On: Here you define the logical breaks the Data Analyzer will create as it processes the data. The selected breaks will then become row and column data items that may be dragged, dropped, and repositioned within the Data Analyzer. There is a maximum of 10 breaks that can be selected per Data Analyzer. Date Fields are an exception. Selecting a Date Field for a break counts as one allowable break, but it will create Year, Quarter, Month, Day, and Weekday breaks within the Data Analyzer. You can also choose how you would like to store the orientation of the field i.e., where you want the field to appear in the row, column or docked. Selecting breaks from the Worksheet Fields list will break on values that occur at the Worksheet Header level. Selecting breaks from the Criterion Fields list will break on values that occur for given criterion within the Worksheet.
Short Desc and Standard No.: You can choose, whether the short description or standard number or both should be displayed for the criterion. If only standard no. is chosen and the criterion does not have a standard no., short description will be displayed instead.
Display: – The data can be displayed as Description Only, ID Only, or ID & Description. Choosing one of these options will display the description from the Attribution Types, ID or both.
Worksheet Header Fields: Here you can apply the filters for Worksheet Header Fields. See Applying Filters below.
Worksheet Criterion Fields: Here you can apply the filters for Worksheet Criterion Fields. See Applying Filters below.
Orientation: For the filter fields you can choose where the fields should be positioned, at row, column or should be docked initially. Once analyzer cube is populated you are free to change the orientation. When the analyzer template is saved the orientation information is stored with it.
Applying Filters: Data Analyzer data can be narrowed by specifying the filters. Choose the Worksheet Fields for which you want to filter by, then choose = (equal to), > (greater than), or < (less than) and finally enter a value which the data should be matched against. Field Data Entry Shortcuts can be used to enter values. You may apply as many filters as necessary. If there are a large number of filters specified, it will be necessary to use the provided scroll bars to the right of the filter list to access them.
All filters have an 'and' relationship not 'or', thus you cannot generate a Data Analyzer for multiple filters for the same Worksheet Field. So if you want to report on two or more Departments choose it in 'Break On'.
Topics Tab
|
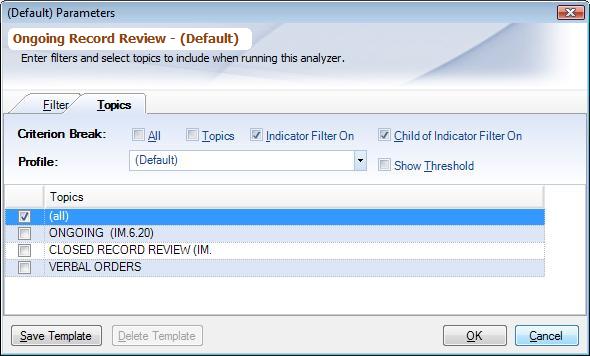
Criterion Break: You can select which criterion to include in the Data Analyzer:
▪All: Will include Topics And Criterion with 'On' and 'Off' reporting filters ('Display Only' will not display in the Data Analyzer).
▪Topics: Will include Topics with 'On' and 'Off' reporting filters.
▪Criterion State On: Will include Parent Criterion with 'On' reporting filters.
▪Child of Criterion State On: Will include sub-criterion whose Parent Criterion have the reporting filter set to 'On'.
Profiles: By default those criterion are shown in the Data Analyzer which have been marked in the '(Default)' profile. You can choose a particular profile from the combo-box. To learn which criterion appear read Topics And Criterion.
Show Threshold: Checking the box will show the threshold along with the short description of the criterion, to do this criterion's short description will be truncated. Unchecking the box will not include the threshold in the Data Analyzer. If threshold is not included in the Data Analyzer it will also not appear in Stacked Bar Chart.
Review Templates: This applies to Global Data Analyzer only. Choose the Review Templates you want to run Data Analyzer for. Select '(All)' for all Review Templates.
When running global Data Analyzer only those fields are shown which are part of the selected Review Templates.
Topics: Choose the Topics that you want to generate the Data Analyzer for. Select '(All)' for all Topics and its Criterion.
A new Data Analyzer Templates can be create by using the 'Save Template' button.

