Overview
Once data is displayed in the Data Analyzer it can be easily oriented to provide different dimension to the same data. It is like 'Pivot Table' with n-dimensions, whose dimensions can be changed on the fly simply by dragging and dropping.
|
Sections
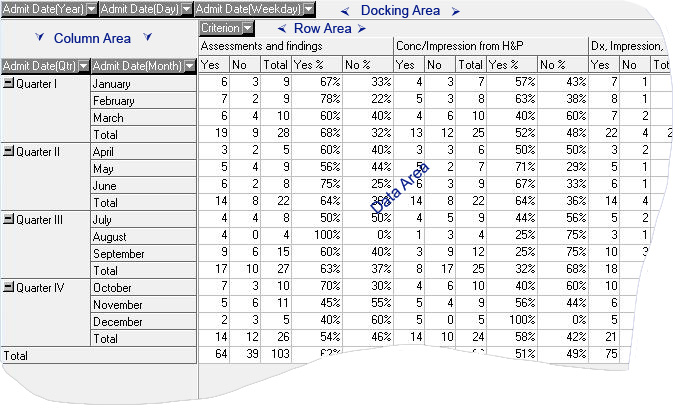
Data Analyzer environment is made up of 4 sections. Any field can be dragged and dropped between the row, column and docking area to change the view of the Data Analyzer. At the time of dragging a green bar will indicate where the Field object will dock. 'Break On' chosen in the Selecting Data Analyzer Parameters dialog box determines which fields will appear in these 3 sections. Fields in the data area are fixed and are pre-determined. Field order within the row and column area can be changed, to change the grouping level.
Row Area: Fields in the row area run left to right.
Column Area: Fields in the column are run top to bottom.
Data Area: Fields in the data area are pre-determined. They are 'Yes', 'No', 'Total', 'Yes %' and 'No %'.
Docking Area: Fields in the Data Analyzer can be removed, by dragging them to docking area, without regenerating the Data Analyzer.
Terminology
Data Fields: Data Fields are Worksheet Fields that you have chosen to 'Break On' in the "Data Analyzer Parameter Dialog": Selecting Data Analyzer Parameters e.g. Admit Date(Year), Department, Criterion. Also referred to as Fields.
Data Items: Data Items are values for these Data Fields. e.g. Identification Data found, Quarter 1, Cardiopulmonary.
Data Values: Data values are the values shown in the data area e.g. 3, 0, 100%. Also referred to as Values.
Print Setup:
▪From the toolbar, click on Print
▪Click Print Preview to view the report
▪Click Print with Prompt to print the current selection, the printer of your choice or allows to choose print options
You have the choice of printing either the long or short criterion description when printing the analyzer cube. Choosing the long description for printing is controlled by clicking on the PDA Professional Start up button->Options->General tab. Check the box Include long description when printing the analyzer cube.
Graph Buttons:
Select the appropriate graph button to plot:
Filtering
Sometimes it is desirable to filter out data items so as not to distract from the data items you want to focus on. For example, you may want to filter out all criterion except 'Existence of Advanced Directives', or 'turn off' all calculations except Yes %. There are two types of Data Analyzer filters:
▪Filtering Rows / Columns: Those that filter out data Items associated with the Field i.e. Criterion, practitioners, departments, etc. Filtering out data Items may be done in one of two ways, by using the drop down list associated with the Field, or by using the filter dialog.
▪Filtering Data Values: Those that filter out Data Values, i.e. Yes, No, Total, Yes%, No%, etc.
•Right click in the Workarea of the analyzer cube and choose Filter. Check or uncheck desired boxes.
Filters can be applied two ways:
▪Filter using drop-down: To filter out data items using the drop down list, simply click the white down arrow associated with the Field. You will be presented with a list of data items belonging to that Field.
▪Using the - unchecks all the boxes,
▪Using the + checks all boxes,
▪Using the toggles all boxes to checked and unchecked,
▪Using the √ check mark will close the box after the desired fields have been filtered
▪Using the X closes the entire box.
Note: Datafields that have been filtered will turn black.
