Dashboard for Desktop > Dashboard Designer > Dashboard Items > Grid > Columns > Measure Column
A measure column displays summaries calculated against data in a bound data item.
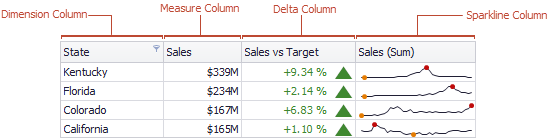
Values in the measure column can be displayed as text or represented by bars.

To select between these modes, invoke the Column Options window (see Column Type Overview to learn how to do this) and select Value or Bar.
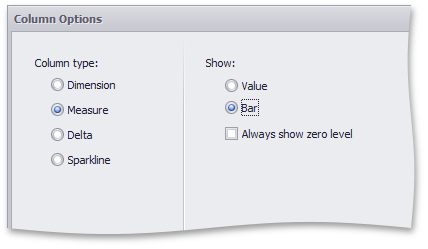
If bars are displayed, use the Always show zero level check box to specify whether the bar's zero level is always visible.

 See Also
Copyright (c) 1998-2016 Developer Express Inc. All rights reserved.
Send Feedback on this topic to DevExpress.