Dashboard for Desktop > Dashboard Designer > Dashboard Items > Grid > Columns > Sparkline Column
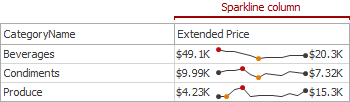
A sparkline column visualizes the variation in summary values over time.

 Data Binding Specifics
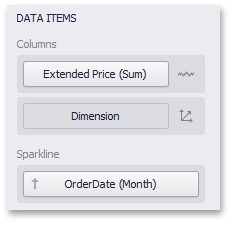
The sparkline column is bound to a measure providing sparkline values and to a dimension providing a date-time interval.
Sparkline Options
You can control sparkline appearance settings using the Column Options dialog. To invoke this dialog, click the column type indicator (![]() ).
).
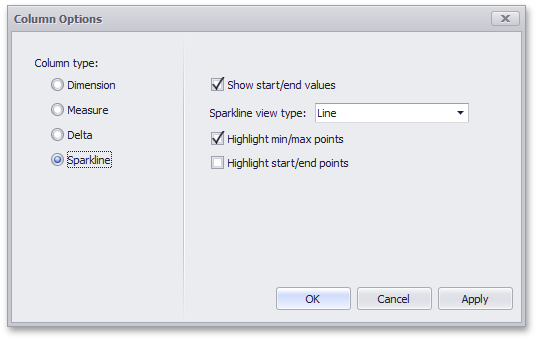
In this dialog, you can control various settings that affect how the sparkline is displayed within a grid cell.
Sparkline Options |
Description |
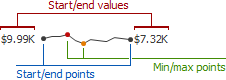
Show start/end values |
Species whether or not to display sparkline start/end values within a grid cell. |
Sparkline view type |
Defines the view type of a sparkline. Sparkline view types include Line, Area, Bar, and Win/Loss. |
Highlight min/max points |
Specifies whether or not to highlight the minimum/maximum points of a sparkline. |
Highlight start/end points |
Specifies whether or not to highlight the start/end points of a sparkline. |
See Also
Copyright (c) 1998-2016 Developer Express Inc. All rights reserved.
Send Feedback on this topic to DevExpress.