Dashboard for Desktop > Dashboard Designer > Dashboard Items > Choropleth Map > Legend
A legend is an element of a map that shows values corresponding to each color.
![]()

 Visibility
To display a legend within a map, use the Show Legend button in the Legend group of the Design Ribbon tab (or the ![]() button if you are using the toolbar menu).
button if you are using the toolbar menu).
Position and Orientation
To specify the legend's position and orientation, select one of the predefined options from the gallery in the Design Ribbon tab.
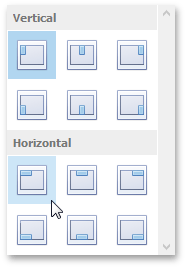
If you are using the toolbar menu, use the ![]() button to invoke this gallery.
button to invoke this gallery.
See Also
Copyright (c) 1998-2016 Developer Express Inc. All rights reserved.
Send Feedback on this topic to DevExpress.