Dashboard for Desktop > Dashboard Designer > Dashboard Items > Geo Point Maps > Providing Data
This topic describes how to bind Geo Point Map dashboard items to data using the Dashboard Designer.
The Dashboard Designer allows you to bind various dashboard items to data in a virtually uniform manner (see Binding Dashboard Items to Data for details). The only difference is in the data sections that these dashboard items have.

 Binding Overview
All Geo Point maps have the Lattitude and Longitude data sections, which accept dimensions used to provide geographic latitude and longitude, respectively.
To learn about the data sections provided by specific Geo Point maps, see the table below.
Dashboard Item |
Data Sections |
Description |
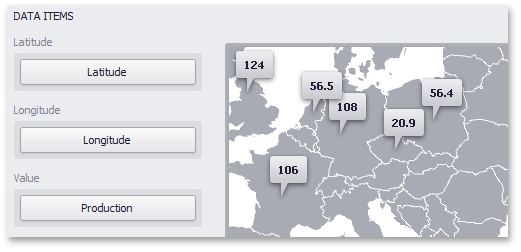
Geo Point Map |
|
The Geo Point Map dashboard item provides the Value data section, which accepts values related to geographic points. These values are displayed within map callouts. |
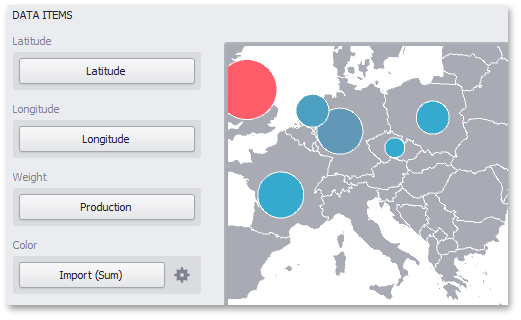
Bubble Map |
|
The Bubble Map dashboard item provides the Weight and Color data sections, which provide measures used to evaluate each bubble's weight and color, respectively. The Bubble Map dashboard item automatically selects palette and scale settings used to color bubbles. To customize these settings, click the Options button next to the Color placeholder. This invokes the Color Scale Options dialog, which allows you to specify the palette and scale options. To learn how to use this dialog, see the Palette and Scale Settings paragraph in the Map Coloring topic. |
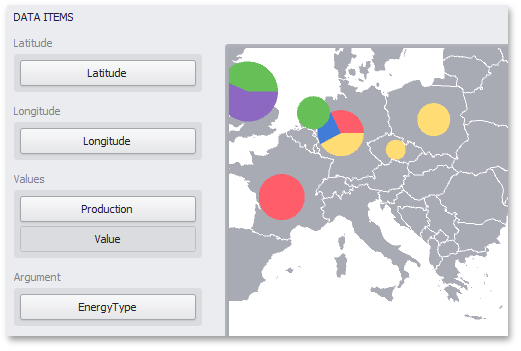
Pie Map |
|
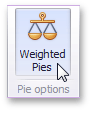
The Pie Map dashboard item provides the Values and Argument data sections. The Values section accepts measures used to calculate pie values. The Argument section allows you to provide data for pie arguments. If you added a data item to the Argument section and several data items to the Values section, you can use the Values drop-down menu to switch between the provided values. To invoke the Values menu, click the Pie Options The Pie Map dashboard item allows you to take into account the weight of pies. In this case, the relative sizes of the pies depend on the corresponding summary values. To enable this capability, use the Weighted Pies button in the Design ribbon tab. (Click the
|
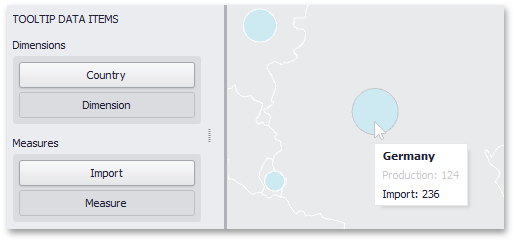
Tooltip Data Items
Geo Point maps allow you to add supplementary content to the tooltips using the TOOLTIP DATA ITEMS area. Drag and drop the required dimensions or measures to provide additional data.
See Also
Copyright (c) 1998-2016 Developer Express Inc. All rights reserved.
Send Feedback on this topic to DevExpress.