Dashboard for Desktop > Dashboard Designer > Dashboard Items > Geo Point Maps > Legends
Geo Point maps provide two types of legends used to identify map objects - color and weighted legends.

 Color Legend
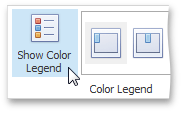
The color legend helps end-users identify which colors correspond to specific values.
![]()
To display a color legend within a map, use the Show Color Legend button in the Color Legend section of the Design Ribbon tab (or the ![]() button if you are using the toolbar menu).
button if you are using the toolbar menu).
To specify the legend's position and orientation, select one of the predefined options from the gallery in the Design Ribbon tab.
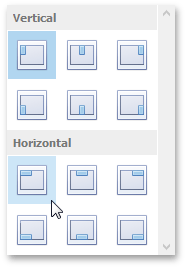
If you are using the toolbar menu, use the ![]() button to invoke this gallery.
button to invoke this gallery.
Weighted Legend
The weighted legend allows end-users to identify values corresponding to specific bubble/pie sizes.

To select the required weighted legend type, use the Show Weighted Legend button in the Weighted Legend section of the Design Ribbon tab (or the ![]() button if you are using the toolbar menu).
button if you are using the toolbar menu).

Note
The Pie Map dashboard item does not display the weighted legend if weighed pies are disabled.
To specify the legend's position, select one of the predefined options from the gallery in the Design Ribbon tab.
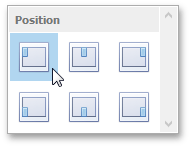
If you are using the toolbar menu, use the ![]() button to invoke this gallery.
button to invoke this gallery.
Copyright (c) 1998-2016 Developer Express Inc. All rights reserved.
Send Feedback on this topic to DevExpress.