Dashboard for Desktop > Dashboard Designer > Dashboard Items > Geo Point Maps > Map Types Overview
The Dashboard Designer allows you to create three types of Geo Point maps.
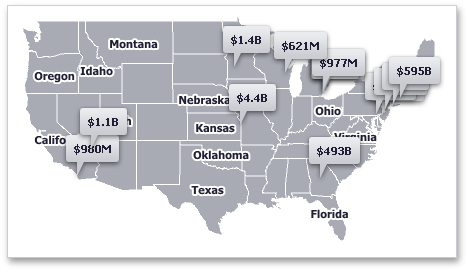
•The Geo Point Map dashboard item allows you to place callouts on the map using geographical coordinates.
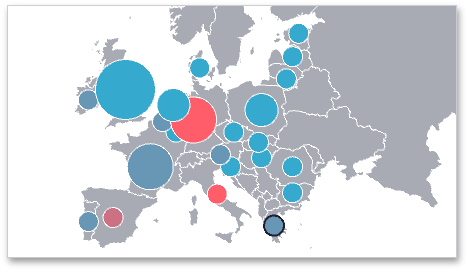
•The Bubble Map dashboard item allows you to place bubbles on the map. Each bubble can represent data via its weight and color.
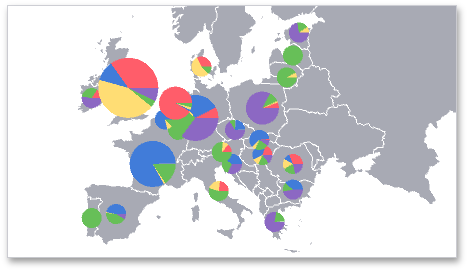
•The Pie Map dashboard item allows you to display pies on the map. Each pie visualizes the contribution of each value to the total.
To create the required Geo Point Map dashboard item, use the Geo Point Maps button in the Home ribbon tab.
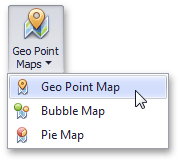
If you are using the toolbar menu, use the ![]() button to select the required map type.
button to select the required map type.
To learn how to provide maps for Geo Point Map dashboard items, see the Providing Maps topic. The Providing Data topic describes how to bind different types of Geo Point maps to data.
The following topics describe various Geo Point map capabilities.
•Clustering - describes how to group neighboring map objects (callouts, bubbles or pies).
•Interactivity - describes capabilities that enable interaction between the Geo Point maps and other dashboard items.
•Legends - describes map legends that allow end-users to identify various map objects (bubbles, pies and pie segments).
Copyright (c) 1998-2016 Developer Express Inc. All rights reserved.
Send Feedback on this topic to DevExpress.