Overview
Reporting data for all Standard Reports can be filtered to run for a given set of parameters e.g. date range, particular practitioner etc. These customized parameters can be saved in report template from Managing Report And Analyzer Templates. Most of these parameters apply to all the reports; few are specific to a particular report.
Filter Tab
|
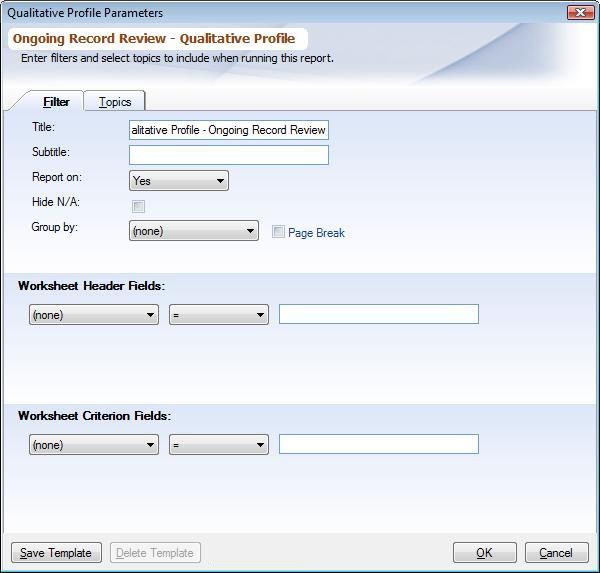
Title: A default title for the report appears, you can enter your own title.
Sub title: A default sub-title for the report appears, you can enter your own sub-title. Note the sub-title keeps changing as you enter your filter parameters, so it is best to change it after you have selected all the parameters.
Report On: When the context is Qualitative Profile Reports (Qualitative Profile, Comparative Qualitative Profile, Quarterly Qualitative Profile, Distribution Qualitative Profile) it can be chosen from:
▪Yes: Displays compliance (Yes) totals and percentage.
▪No: Displays non-compliance (No) totals and percentage.
When choosing for General Compliance Report it can be set to:
▪Yes: Displays only those records that are compliant (Yes).
▪No: Displays only those records that are non-compliant (No).
▪N/A: Displays only those records that are not applicable (N/A).
▪All: Displays all records.
Hide N/A In Qualitative Profile Reports (Qualitative Profile, Comparative Qualitative Profile, Quarterly Qualitative Profile, Distribution Qualitative Profile) you can hide the records which have been evaluated not even once. Hiding N/A's removes the clutter from the report, allowing you to concentrate only on the Topics And Criterion that have been evaluated. Remember, that checking / un-checking the box does not affect where N/A records will be included in the computing the 'Total' column, N/As are always ignored for computation of 'Total', rather this option hides the Topics And Criterion which have zero 'Total'.
Group by: Qualitative Profile Reports (Qualitative Profile, Comparative Qualitative Profile, Quarterly Qualitative Profile, Distribution Qualitative Profile) and Number Of Criterion Evaluated can create sub-reports within the report grouped by this field. Reports can be grouped only by Worksheet Criterion Fields. This can be very helpful when you want to generate a report for all the Attribution Type Objects e.g. for all the departments with separate sections for each department.
Page Break: When choosing 'Group by', each group will start on a new page, check this box to start a new page for every group.
Low Range: This applies only to the Percentage Compliance Report. Here you can specify the minimum value for the compliance. Value should be between 0 and 100.
High Range: This applies only to the Percentage Compliance Report. Here you can specify the maximum value for the compliance. Value should be between 0 and 100.
Choose Date: This applies only to the Quarterly Qualitative Profile. Choose the date you want to use to determine the quarters for the report. Only dates from the Worksheet Header Fields can be chosen here. If a Worksheet does not have that particular date entered that Worksheet will be skipped.
Year: This applies only to Quarterly Qualitative Profile. Enter the year for which you want to generate the report. Along with the four quarters for this year, last year totals are also reported for comparison purposes.
Hide records with no comments: In General Compliance Report you can hide the records for which there is no comment entered in Worksheet Data Entry. By checking this box, only those records will be displayed in the report for which comments exists.
Deficiencies >=: When generating Letters, you can use this option to generate letters for only those Attribution Type Objects (physicians) who have more than n number of deficiencies e.g. you can print letters for only those who have failed on more than 3 criterion.
Worksheet Header Fields: Here you can apply the filters for Worksheet Header Fields. See Applying Filters below.
Worksheet Criterion Fields: Here you can apply the filters for Worksheet Criterion Fields. See Applying Filters below.
Applying Filters: Reporting data can be narrowed by specifying the filters. Choose the WorksheetFields for which you want to filter, then choose = (equal to), > (greater than), or < (less than) and finally enter a value which the data should be matched against. Field Data Entry Shortcuts can be used to enter values. You may apply as many filters as necessary. If there are a large number of filters specified, it will be necessary to use the provided scroll bars to the right of the filter list to access them.
All filters have an 'and' relationship not 'or', thus you cannot generate a report for multiple selection for the same Worksheet Field. So if you want to report on two or more Departments, either run the same reports twice (one department at a time) or choose Group by.
Topics Tab
|
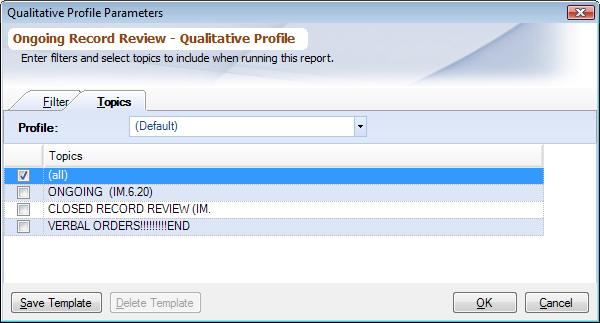
Profiles: By default those Criterion are shown on the report which have been marked in the '(Default)' profile. You can choose a particular profile from the combo-box. To learn which Criterion appear in a report read Topics And Criterion.
Topics: Choose the Topics that you want to report on. Select '(All)' for all Topics and its Criterion.
Review Templates: This applies to Global Reports only. Choose the Review Templates you want to run reports for. Select '(All)' for all Review Templates.
When running global reports only those fields are shown which are part of to all the selected Review Templates.

