OVERVIEW
Standard Reports are 'canned' reports designed to report on specific data from a Review Template. From the 'Folder Items' list double click on desired Review Template, then click on 'Reports' select desired report and double click. Now double click on 'Default'
INSERTING YOUR COMPANY LOGO:
You can now insert or brand the Standard Reports with your company logo.
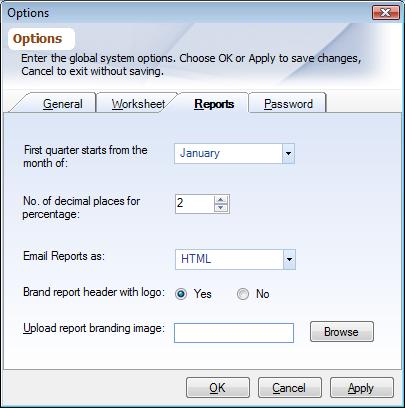
▪From the toolbar, click on the PDA Start Button-> Options -> Report tab.
▪Set the option to Yes to brand your company logo
▪Browse out to locate your company logo. Your logo will be placed on top of the Stabdard reports
|
PROFILE PARAMETERS DIALOG BOX:
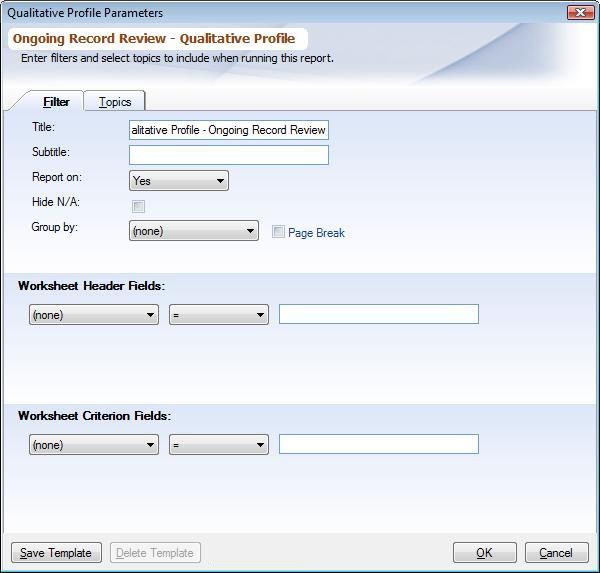
Allows you to set up specific parameters for each report. Contains two Tabs, 'Filter' and 'Topics'
oFILTER TAB, is used to Title and Subtitle the report as well as select the parameters of choice, and Save Template
•Select Worksheet Header fields (Typically used to enter date ranges)
•Select Worksheet Criterion fields (Allows sorts by various data elements) As a general rule, practitioner or department should be selected from the Worksheet Criterion Fields
•Once field is selected an =, >, <, is selected an * can be entered, press tab for values to display
|
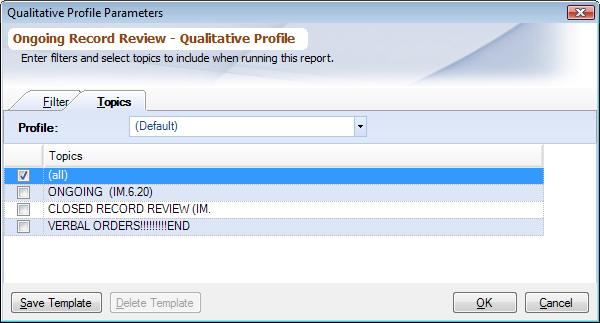
TOPICS TAB
Used to select the Topics to report on and the Review Template Profile of choice
|
SAVE A REPORT TEMPLATE:
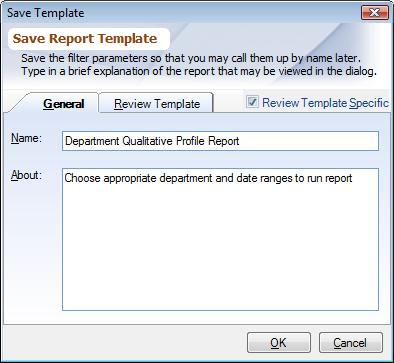
oSaves the report selection parameters under a given name so you can regenerate the report without setting up the parameters again
▪Click on Save Template enter a title and description. If you would like this template to only apply to a specific Review Template, then check the 'Review Template Specific' box and choose desired Review Template, and then click Save. This saves the template for all chosen Review Templates.
|
DELETE A REPORT TEMPLATE:
▪Highlight the template icon in the worksheet work area, click Delete
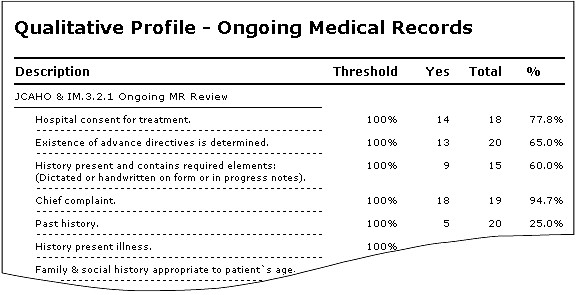
QUALITATIVE PROFILE REPORT:
An overall view of data numerator vs denominator
▪Yes' values in numerator; 'No and Yes' values in denominator; 'N/A' values not counted
|
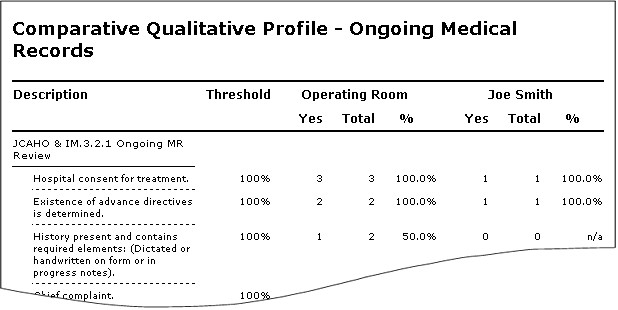
COMPARATIVE QUALITATIVE PROFILE REPORT:
Compare I to Compare II Fields.''' Provides a comparison of one criterion to another.
▪Select the item you are interested in comparing 'Compare I' to the item you want to compare it to 'Compare II'
▪Click on Topics tab and select desired topics
|
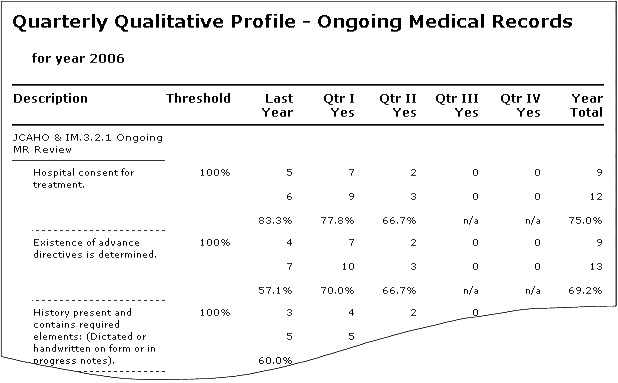
QUARTERLY QUALITATIVE PROFILE REPORT:
Designed to give you 4 sets of numerators and denominators
▪Select date field and year to generate report starting point
▪Beginning of Quarter established by clicking on the PDA Start Button-> Options-> Report tab.
|
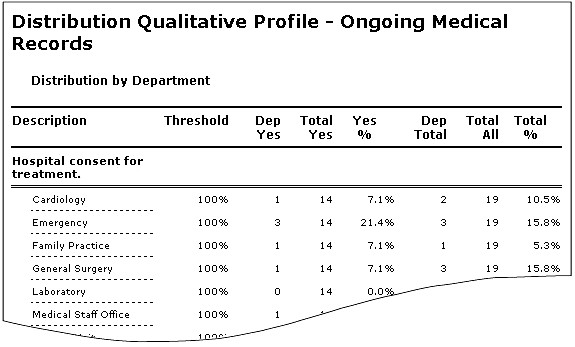
DISTRIBUTION QUALITATIVE PROFILE REPORT:
This report compares worksheet criterion attributes for a given criterion. You can compare various departments or practitioners for a given indicator.
▪This report pulls the data from a criterion level only
|
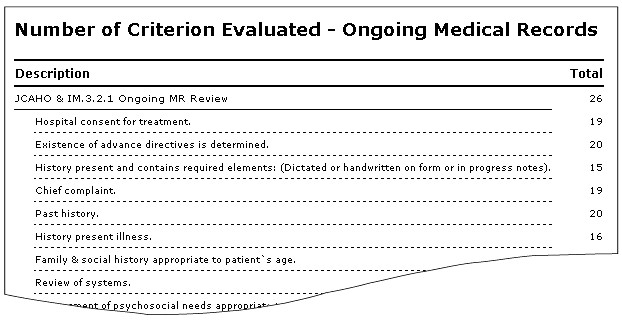
NUMBER OF CRITERION EVALUATED REPORT:
Provides an easy way to retrieve the number of times a criterion was evaluated within a study.
▪Total will include repeated criterion
|
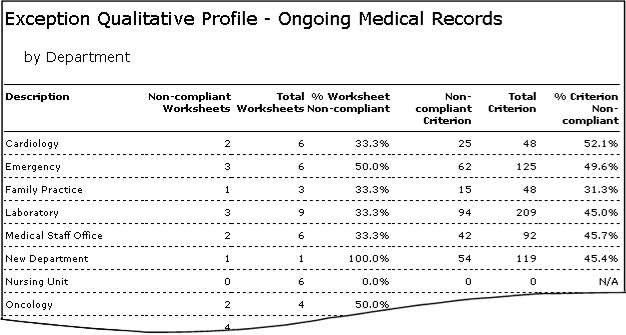
EXCEPTION QUALITATIVE PROFILE REPORT:
This report allows you to look at a particular physician or department and see how many worksheets fell out or were not compliant by criterion
▪This report pulls the data from a criterion level only
|
Note: The Qualitative Reports display criterion that do not meet the threshold in red so offenders can easily be spotted
COMPLIANCE REPORTS:
Designed to list chart demographics that either 'fall in' or 'fall out' for specific criterion.
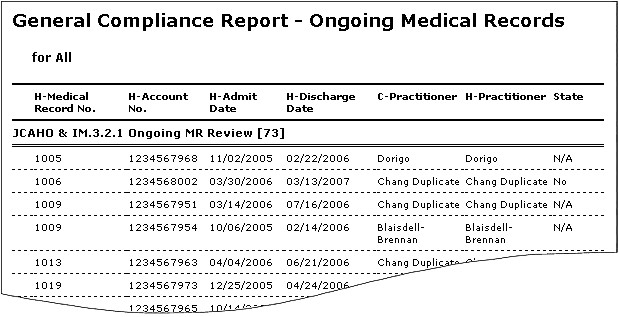
GENERAL COMPLIANCE REPORT :
•Choose 'All' to report on all values, 'No' to report on those that have no values, 'Yes' for yes values, 'N/A' for N/A values.
•Criterion must be 'On' to view data
•You can create a Profile with all criterion turned 'On' in Manage Review Template Profiles. See Training Guide Part I
|
Note: This is where you view your comments entered during worksheet data entry
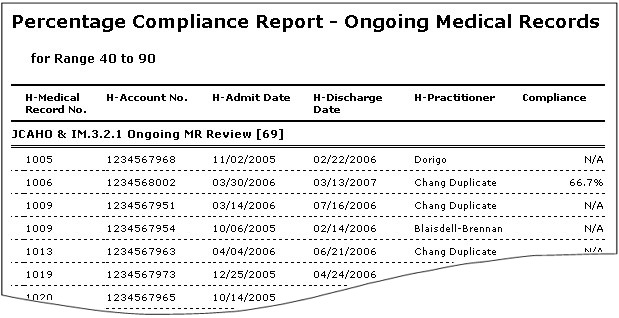
PERCENTAGE COMPLIANCE REPORT:
Will evaluate the children of a criterion for the numerator/denominator percentage. Takes an average of all criterions. Finds cases where averages for specific topic criterion falls between the specified range
•Enter desired range to report on
•Criterion must be 'On' to view data
•You can create a Profile with all criterion turned 'On' in Manage Review Template Profiles. See Training Guide Part I
|
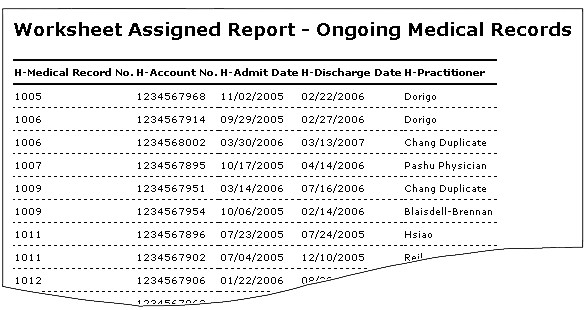
WORKSHEET ASSIGNED REPORT:
Finds all worksheets in a given study.
▪Last page of report provides a total count of records reviewed
|
COMMENTS IN REPORTS:
Comments can be added to a criterion or at the end of the report, once a report has been generated.
▪To add a comment right-click on any criterion or on END OF REPORT.
LETTERS:
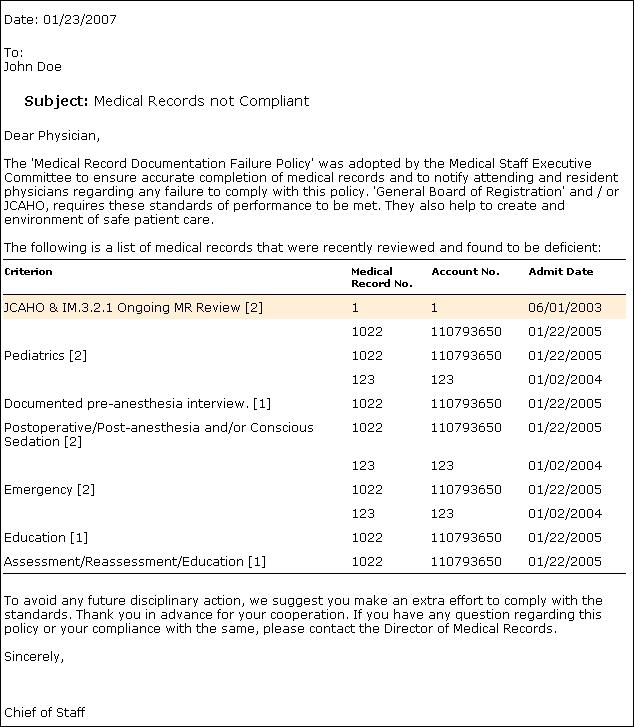
The application has the ability to directly print out a letter of delinquent records either by physician, department, unit etc. Anything you may have on a criterion level. You have the ability to customize the text of the letter.
▪From the Folder Items list, click on desired ReviewTemplate->Reports-> letter
▪Click the Default icon.
▪Click the Paragraph tab
▪Edit text as desired and click Saved Template for future use. Letters can include physician address, department names or any other Attribution Types desired. See Training Guide Part II Managing Attribution Types
|
EDITING A REPORT:
▪With the report open, click on Edit from the toolbar. This will allow you to regenerate the report with different parameters.
PRINTING A REPORT:
▪With the report open, click on Print from the toolbar
▪Print Preview to view the report
▪Print with Prompt to print the current selection, the printer of your choice or allows to choose print options
EXPORTING A REPORT:
▪With the report open, click on Export from the toolbar. You have the option to export as an Excel, Word, HTML, XML or .CSV documents.
E-MAILING A REPORT:
▪With the report open, click on Email from the toolbar
SAVING A REPORT:
▪With the report open, click on Save from the toolbar (Floppy disk). The saved report is stored in the Recall folder.
RECALLING A SAVED REPORT:
▪From the Folder Items list, click the Recall folder within a Review Template or Global, Reports
CLOSING A DISPLAYED REPORT:
▪Click on the PDA Start Button and then Close, Close Current, Close All but Current or Close All
A unique and innovative tool that allows you to redefine the way you view your data.
▪From the Folder items list, click on desired Review Template, and then the Analyze icon
▪Click on 'Default' icon
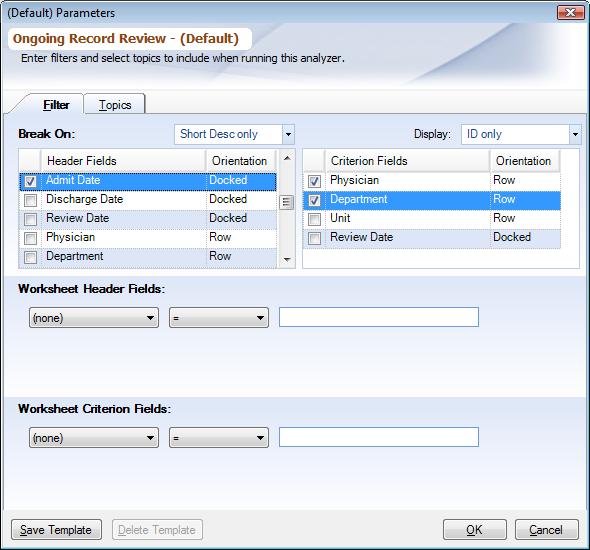
FILTER TAB:
▪Break On fields select based on worksheet and criterion fields that will appear in the Data Analyzer
•Worksheet fields are entered at the Worksheet Attributes dialog box. You can also choose the orientation of the field i.e., where the field should appear in a row, column or docked.
•Criterion fields are attributed to criterion within a worksheet
▪Display: Select how the data should be displayed (for example: a practitioner’s name (description) versus the practitioner’s ID) Description Only, ID Only or ID & Description
▪Worksheet Attribute Filter typically used to enter date ranges, or to specify values.
▪Criterion Attribute Filter can be used to specify values and are attributed to criterion within a worksheet
▪Saving Template saves the Data Analyzer cube parameters under a given name so you can regenerate the report without setting up the parameters again.
•Click on Save Template enter a title and description, then click Save. This saves the template in the Review Template for the Data Analyzer and Global. If you would like the saved template to only apply to a specific Review Template, then check the 'Review Template Specific' box and choose desired Review Template, and then click Save. This saves the template for all chosen Review Templates.
|
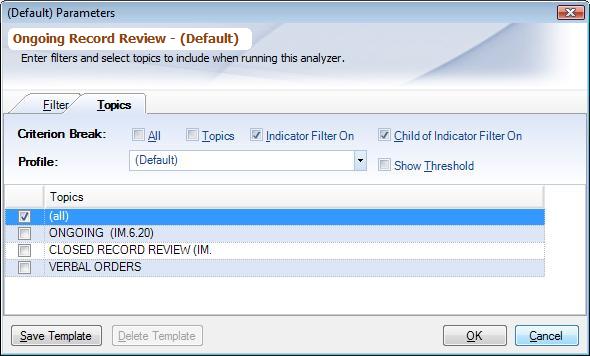
TOPICS TAB:
Use the Topics tab to select which topics to include in the report.
oCriterion Break, select;
▪All: will include topics and criterion with On and Off reporting filters
▪Topics: will include topics with On and Off reporting filters
▪Criterion State On: will include criterion with reporting filters turned On
▪Child of Criterion State On: will include "sub-criterion": WorkingWithTopicsAndCriterion(children) with reporting filters turned On
oProfile, select based on what is defined in Review Template Profiles
oCheck the Show Thresholds box if you choose to have the thresholds show in the Data Analyzer cube
oSelect specific "Topics": Working With Topics And Criterion or All Topics
|
WORKING WITH THE DATA ANALYZER:
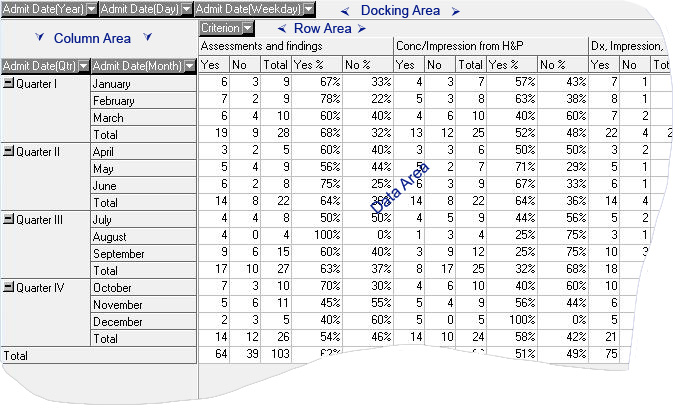
The Data Analyzer environment is made up of 4 sections and provides a convenient way to select the most common functions available for working in the Analyzer cube.
Any field can be dragged and dropped between the row, column and docking area to change the view of the Data Analyzer. At the time of dragging a green bar will indicate where the Field object will dock. 'Break On' chosen in the Selecting Data Analyzer Parameters dialog box determines which fields will appear in these 3 sections. Fields in the data area are fixed and are pre-determined. Field order within the row and column area can be changed, to change the grouping level.
▪Row Area: Fields in the row area run left to right.
▪Column Area: Fields in the column are run top to bottom.
▪Data Area: Fields in the data area are pre-determined. They are 'Yes', 'No', 'Total', 'Yes %' and 'No %'.
▪Docking Area: A holding station for DataFields not being reported on
▪Left click, hold and drag DataField, i.e., practitioner, department, unit etc. to desired position
|
FILTERING:
Gives you the ability to filter out data items so as not to distract from the data items you want to focus on.
FILTERING USING THE DROP-DOWN:
To filter out data items using the drop down list, simply click the white down arrow associated with the Field. You will be presented with a list of data items belonging to that Field.
▪Using the - unchecks all the boxes,
▪Using the + checks all boxes,
▪Using the asteric symbol toggles all boxes to checked and unchecked,
▪Using the √ check mark will close the box after the desired fields have been filtered
▪Using the X closes the entire box.
▪To filter numeric values, i.e., Y/N/Total/%, right-click on numbers, select 'Filter'
EDITING AN ANALYZER CUBE:
▪With the cube open, click on Edit from the toolbar. This will allow you to regenerate the cube with different parameters.
PRINTING AN ANALYZER CUBE:
▪With the report open, click on Print from the toolbar or
▪Click Print Preview to view the report or
▪Click Print with Prompt to print the current selection, the printer of choice or choose print options
Note: You have the option to print either the short or the long criterion description. Click on the Start up button->Tools-> Options->Report tab
EXPORTING AN ANALYZER CUBE:
▪With the report open, click on Export from the toolbar. Export will save only what is displayed on the screen. When exporting, the long description is available in the export dialog box.
SAVING AN ANALYZER CUBE:
This allows you save the Data Analyzer cube that you have run without having to go through the process of generating the data again.
▪With the cube open, click on Save from the toolbar (Floppy disk). The saved cube is stored in the Recall folder.
RECALLING A SAVED ANALYZER CUBE:
▪From the Folder Items list, click the Recall folder within a Review Template or Global,
STANDARD NUMBER IN ANALYZER:
▪You can choose to show the standard number and/or the short description with the criterion. If no standard number is present the short description is displayed instead.
Graphs are created from Data Analyzer views. All graphs are plotted by highlighting the columns.
Used to evaluate Yes/No compliance for a range of criterion.
▪Highlight the Yes and No column, and then click on Stacked Bar icon picture
▪Note: Rows is what you are graphing and columns is what you are comparing
Used to compare values against multiple facilities, departments, practitioners, etc.
▪Highlight any one column, and then click on Bar Chart
▪Note: Does not show Yes/No relationship just displays values
Used to depict facilities, departments, and practitioner’s contribution to the total.
▪Highlight any one column, and then click on Pie Chart
Used to determine whether criterion compliance or processes are 'under control'.
▪Based over a period of time
A Pareto chart is a bar graph. The lengths of the bars represent frequency or most significant, and are arranged with longest bars on the left and the shortest to the right.
▪An accumulation of totals that highlights the most offended categories
GRAPH CUSTOMIZATION OPTIONS:
By using your toolbar options
▪Title and sub title the graphs
▪Show data points
▪Use a legend or not
▪Zoom in, rotate, increase, decrease, elevate view in 2D and more...
▪Plot different types of graphs on a single canvas
EDIT GRAPH PARAMETERS
▪Use the Analyzer tab to toggle back to the Analyzer cube and re highlight the columns to regenerate the graph
PRINTING A GRAPH:
▪With the graph open, click on Print from the toolbar or
▪Click Print Preview to view the report or
▪Click Print with Prompt to print the current selection, the printer of choice or choose print options
EXPORTING A GRAPH:
▪With the graphs open, click on Export from toolbar. You can choose to Copy to Clip board and paste in desired area or Save to File to save on your hard drive.
SAVING A GRAPH:
This allows you save the graphs that you have run without having to go through the process of generating it again.
▪With the graphs open, click on Save from the toolbar (Floppy disk).
▪Name graphs, and add any comments, if necessary click 'OK'
▪The saved graph is stored in the Recall graph folder.
RECALLING A SAVED GRAPH:
▪From the Folder Items list, click the Recall folder within a Review Template or Global
